%%{init: {"theme": "neutral", "fontSize": 15, "flowchart": {"curve": "basis", "nodeSpacing": 38, "rankSpacing": 55}}}%%
flowchart TB
    QR["Quantitative Researcher<br/>n = 54"]
    DS["Data Scientist<br/>n = 513"]
    DA["Data Analyst<br/>n = 314"]
    AE["Analytics Engineer<br/>n = 102"]
    DE["Data Engineer<br/>n = 458"]
    ML["ML Engineer<br/>n = 278"]
    RS["Research Scientist<br/>n = 161"]
    AI["AI Engineer<br/>n = 730"]
    FD["Forward Deployed<br/>n = 468"]
    QR ---|"1.33<br/>statistics, forecasting"| DS
    DA ---|"1.29<br/>SQL, BI ↔ Python, classical ML"| DS
    AE ---|"1.47<br/>dbt, pipelines ↔ BI, product analytics"| DA
    DE ---|"0.95<br/>cloud, Spark ↔ SQL, dbt"| AE
    DS ---|"1.11<br/>+ MLOps, serving, containers"| ML
    RS ---|"1.02<br/>research, experimentation ↔<br/>MLOps, serving, CI/CD"| ML
    ML ---|"1.06<br/>+ LLM apps, agents, NLP"| AI
    DS ---|"1.43 direct"| AI
    AI ---|"1.39<br/>LLM apps, NLP ↔<br/>customer-facing, stakeholders"| FD
    linkStyle 5,7,8 stroke-dasharray: 6 5;
    classDef inf fill:#dbe8f8,stroke:#0072B2,color:#0b0b0b;
    classDef eng fill:#fde3d8,stroke:#D55E00,color:#0b0b0b;
    classDef data fill:#e4dde9,stroke:#882255,color:#0b0b0b;
    classDef hinge fill:#0072B2,stroke:#0072B2,color:#ffffff;
    class QR,DA,DS inf;
    class AI,FD,RS eng;
    class AE,DE data;
    class ML hinge;
AI / Data Job Skills
Across ~3,100 job ads European employers posted in 2026, AI and data work has spread beyond the Data Scientist title: a spread of titles divides the skills between them, and a data scientist ad now asks for deployment as well as a model.
Executive summary
AI and data work has spread beyond the Data Scientist title. 3,133 job ads for 10 data and AI titles, hiring in Germany, EU-wide, worldwide-remote or the UK, 2026-04 to 2026-10. A model judge read each in full and answered the same 44 questions of every one — does this ad require this skill.
| Research question | Answer |
|---|---|
| RQ1 · Which skills do employers ask for together? | Three groups. Engineering, deployment & AI (82% of ads), data platform (83%), statistics & inference (52%) — plus communication at 79%, required everywhere. |
| RQ2 · Does the classic data science definition still describe what employers advertise? | No. 31% of job ads sit in the “danger zone” the definition treats as rare; 50% need a skill none of its three circles covers; 67% need deployment, which none of them contains. |
| RQ3 · How do the 10 titles divide that work between them? | One title per region. The centre is 35% of ads and 72% of it is not Data Scientist. “AI Engineer” is the most advertised title at 23%. |
Three results behind those answers:
- Stakeholder communication is the most-required skill at 71%, ahead of Python at 55%.
- A Data Scientist ad asks for the model and for running it — 49% need both.
- Statistics is what separates the two headline titles: 73% of Data Scientist ads require it, against 11% of AI Engineer ads.
The sample
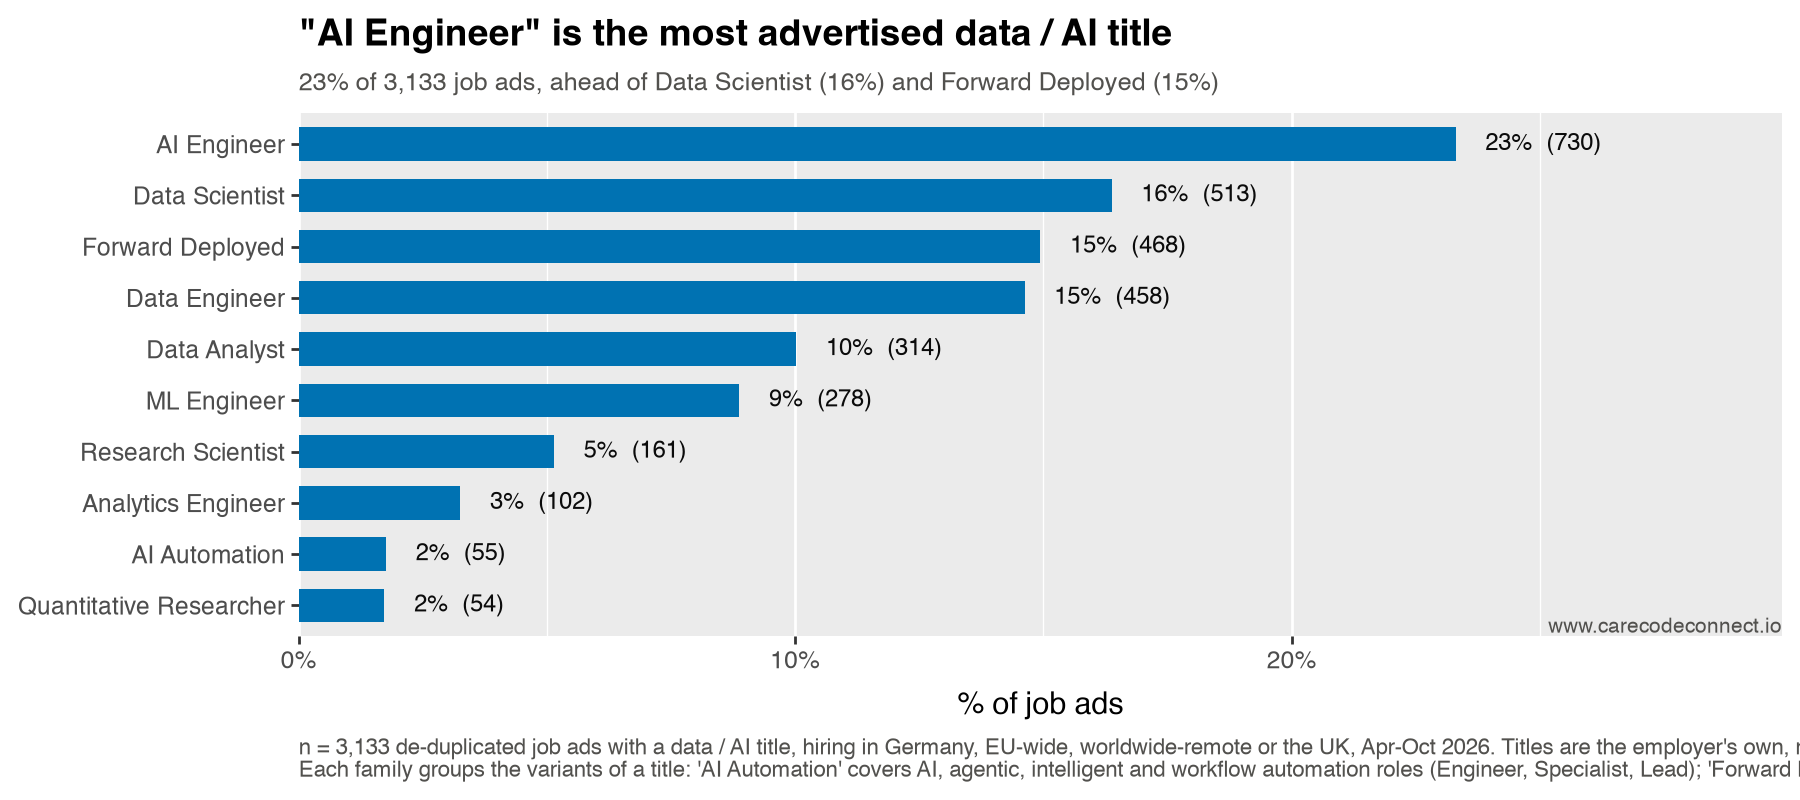
One family is not comparable with the others. AI Automation entered the crawler’s title rules in the final days of the window, so its 2% share is a floor rather than a measurement: 53% of its 55 job ads fall in the final month, against 35% for the sample as a whole. The earlier ones reached the pool through a backfill from a second source rather than through the crawler’s own searches, so the family was never collected at a steady rate. Its skill profile is unaffected; only its size is.
The rarest titles are Analytics Engineer (3%) and Quantitative Researcher (2%); “AI Engineer” includes variants such as “Senior Software Engineer – AI”.
Most of these job ads are not entry-level
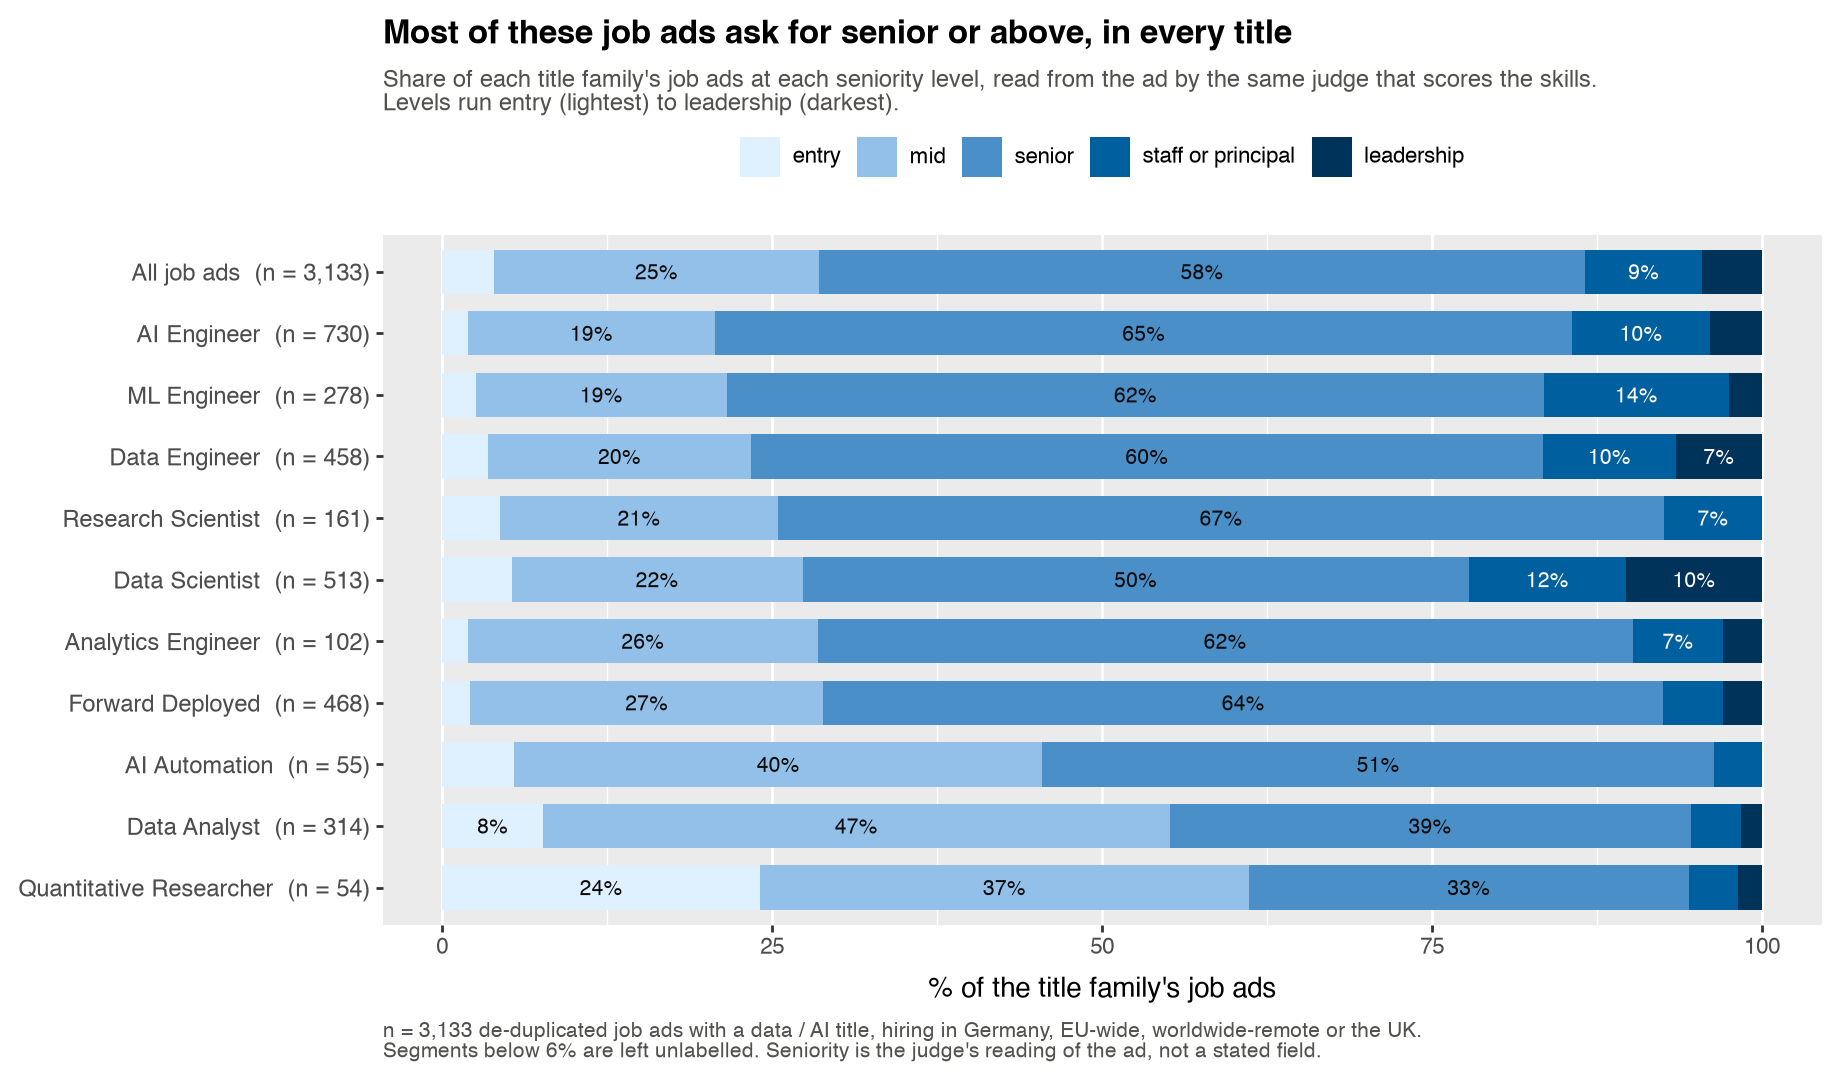
71% of the job ads ask for senior or above, against 29% at entry or mid. The same judge that scores the skills also reads a seniority level off each ad, on five levels from entry to leadership.
- Entry-level is 4% of the sample — 123 job ads across 10 titles. The one title that advertises it at any scale is Quantitative Researcher, at 24%.
- The titles differ sharply. Senior-and-above runs from 39% (Quantitative Researcher) to 79% (AI Engineer) — a spread of 40 points. The newer engineering titles skew senior; the analyst and researcher titles carry what junior hiring there is.
- What changes with level is responsibility, not tooling. mentoring / leadership is the skill that moves most across the five levels — 5% of entry ads against 93% of leadership ads, a climb of 88 points. Python barely moves (53% to 43%). A senior ad is not asking for different tools.
- This is what the ads ask for, not what the market contains. A crawler built to find roles for an experienced candidate will over-sample senior ads, and the filters that select these job ads are not neutral between levels. Read the ranking across titles, not the level as a population estimate.
NoteWhere the job ads come from
- 3,133 job ads, de-duplicated, with a data / AI title: AI Engineer 730, Data Scientist 513, Data Engineer 458, Forward Deployed 468, Data Analyst 314, ML Engineer 278, Research Scientist 161, Analytics Engineer 102, Quantitative Researcher 54.
- Where they hire: Germany, EU-wide remote, worldwide remote, or the UK. Live 2026-04 to 2026-10.
- Where they come from: employers’ own boards and careers pages, aggregators, and a curated feed. The published data carries no source or employer, and the same opening reached by two routes counts once (matched on URL and on company + title).
- Titles come from the ad, by regular expression over the job title; “AI Engineer” includes variants such as “Senior Software Engineer – AI”.
- Not a random sample. These are the ads a personal crawler targets, so they describe what the titles ask for, not how many of each exist.
NoteHow the skills were scored
Scores come from the production pipeline of jobcrawler, a personal job-board crawler that scrapes employer ATS boards, filters by title and location with deterministic rules, and stores each ad. After storage every ad is read once by Jev (TypeSafe’s System One model (TypeSafe 2026), version jev-1.13), which answers typed questions and returns probabilities rather than text.
- For each of 44 tracked skills Jev answers one four-level question: does the ad not involve the skill, mention it in passing, list it as nice to have, or require it. One question per skill, so an answer cannot contradict itself, and the same question is answered for every ad — which is the only reason the percentages compare across titles.
- An ad requires the skill when “required” reaches probability 0.6. Most judgements come back “not involved”; roughly one in six reaches “required”.
- Jev has no part in choosing the ads: the pool is gathered and filtered by rules.
- Cost: about 6k input tokens per ad, under a cent.
The scores are model judgements, consistent across titles but never checked against human labels: read the percentages as what a careful reader of the ad would conclude, with a few points of noise. “Required” is a high bar — every percentage counts ads where the skill reaches required, not ads that mention it. Across all ads, Jev reads machine learning as mentioned in 17% and the second pass by Claude Haiku 4.5 names it in 28%, against 17% requiring it. Agreement on the required call is moderate (Cohen’s κ ≈ 0.36), so treat a single figure as approximate and the direction as solid.
NoteThe data, the charts, and permissions
The files published with this page, from which every figure on it is computed:
- ai-data-job-skills.csv — one row per job ad: the title, which title family it falls into, the judge’s own role-family answer, the hiring region, the month, its position on the map, a yes/no flag for each of the 44 tracked skills, and four columns from the open-vocabulary second pass (how many phrases it extracted, and whether the ad names machine learning, names an ML tool, or requires it).
- skill-mentions.csv — one row per phrase the second pass extracted: how many mentions and job ads it appears in, how often it is required, which tracked skill it maps to, and how many of the data-science ads that never write “machine learning” use it.
- skills.json — the 44 tracked skills and their areas.
Deliberately absent from all three: employer names, links, and any ad text. Both CSVs are rebuilt from the crawler’s database by one script, so re-running it moves every number on this page.
Static charts are drawn with plotnine and Matplotlib; the interactive map uses Plotly, styled to match. Colours come from the Okabe-Ito colour-blind-safe palette, checked with a validator rather than by eye: every categorical palette here passes adjacent-pair separation for deuteranopia, protanopia and tritanopia, and the normal-vision floor. Where a chart would have needed more than about five categorical colours, it does not use them: the per-title charts are single-hue, stacked bars carry their values in the segments, and seniority — being ordered rather than categorical — uses one hue from light to dark. Where ten titles must be told apart at once, on the interactive map, each also has its own marker shape, so colour never carries identity alone.
Conway’s diagram is reproduced with attribution from drewconway.com (Drew Conway, The Data Science Venn Diagram, 2010). Only the measured figures and the 2026 groups are this page’s own.
RQ1 · Three groups of skills, and one asked for everywhere
Which skills do employers ask for together?
Pooled across every title, this is what employers ask for. stakeholder communication leads at 71%, then software engineering (69%) and Python (55%). The tail is the specialist end: computer vision 4%, streaming 4%, R 3%, time series 3%, quant finance research 2%.
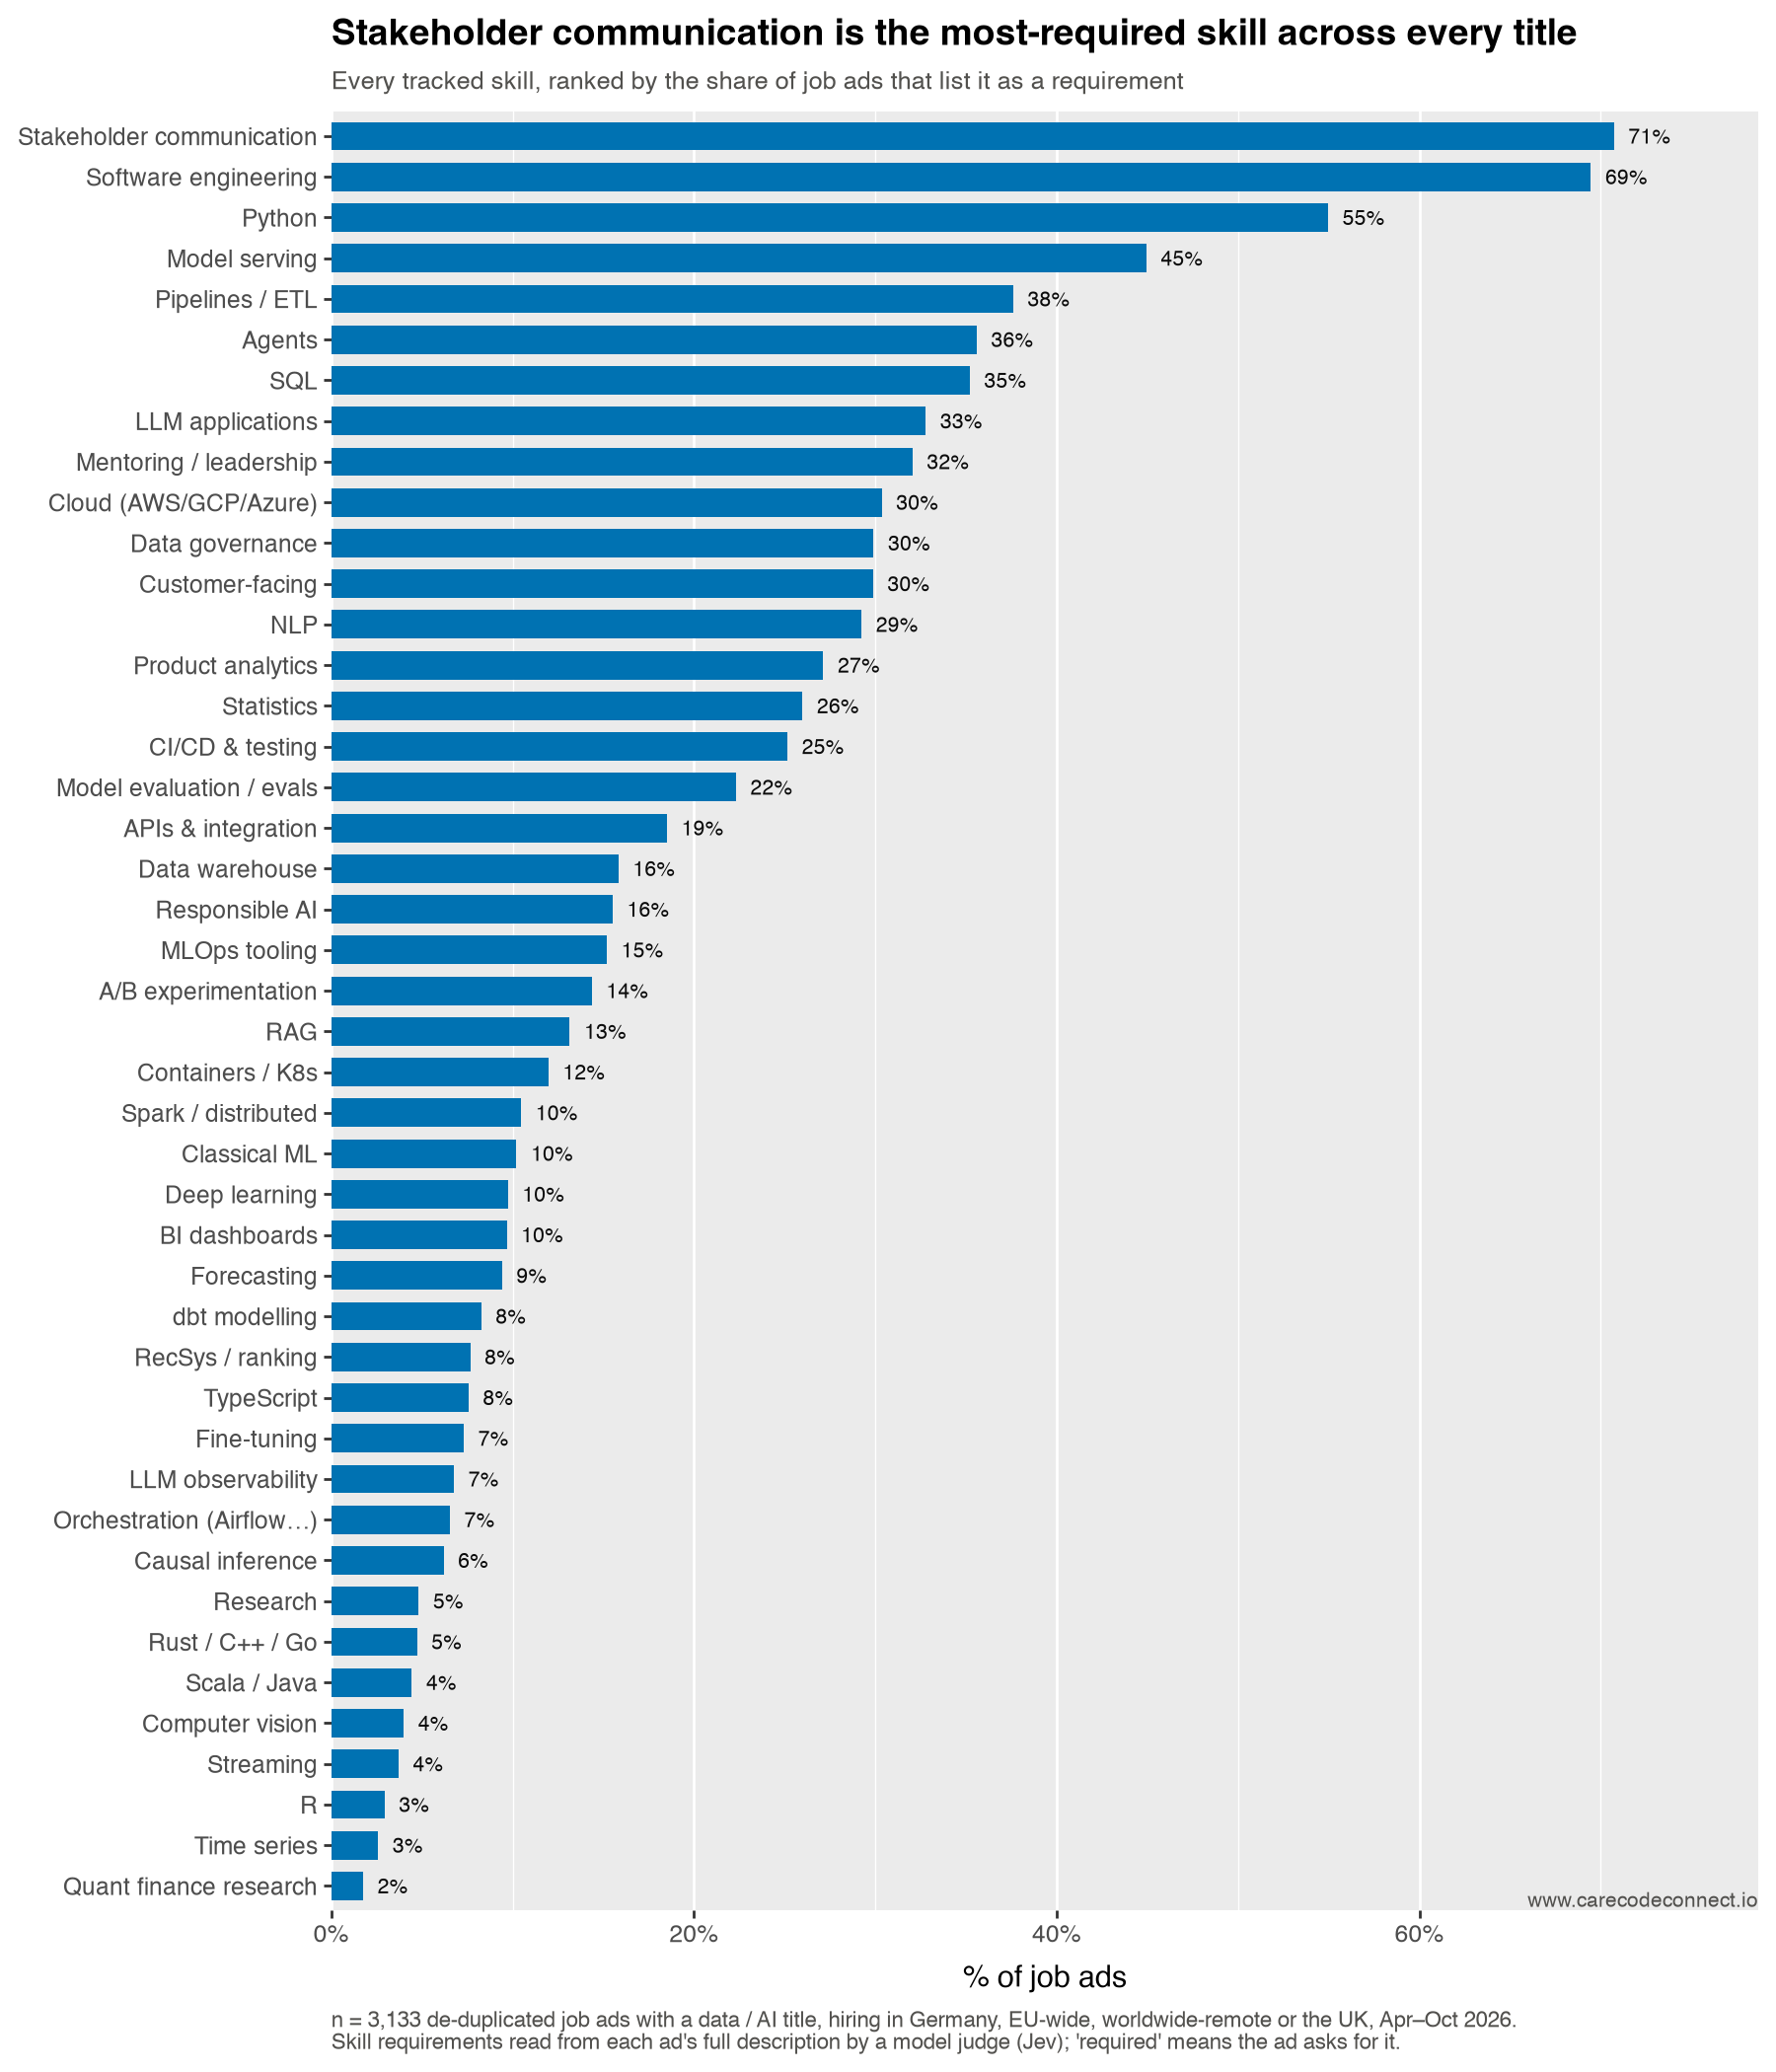
That ranking is the whole market at once, and it hides the structure: a skill near the top may be near the top everywhere, or it may be near the top only because one large title demands it. So the 44 skills were also clustered by how often employers ask for them in the same ad. Four groups fall out — three that divide the market, one required almost everywhere.
- Engineering, deployment & AI — 14 skills, 82% of ads. Shipping software and building on LLMs fall in one group. Most required: Software engineering, Model serving, Agents, LLM applications, NLP, Model evaluation / evals.
- Data platform — 14 skills, 83%. Most required: Python, Pipelines / ETL, SQL, Cloud (AWS/GCP/Azure), Data governance, CI/CD & testing.
- Statistics & inference — 13 skills, 52%. Classical ML, deep learning and computer vision cluster here, not with LLM work. Most required: Product analytics, Statistics, A/B experimentation, Classical ML, Deep learning, BI dashboards.
- Communication — 3 skills, 79%, in every region. The ground, not a circle. Most required: Stakeholder communication, Mentoring / leadership, Customer-facing.
NoteWhere the skill list comes from, and how it grows
The 44 skills are a fixed vocabulary, not everything an ad might mention. A free-for-all count of whatever words appear cannot compare titles, because no two employers use the same words.
The list is curated but not frozen, and two passes read every ad. Pass one is Jev, above. Pass two is an open-vocabulary extraction: a small, cheap model (Claude Haiku 4.5) reads each ad with one instruction — list every skill, tool or method it asks for, in the ad’s own words, say whether it is required or nice to have, and quote the sentence showing it. Nothing is matched against the vocabulary at this stage; the model does not know it exists.
That covers the whole pool: 69,875 mentions across 13,827 distinct phrases, 976 of them in ten ads or more. An alias table maps a phrase onto a vocabulary skill where the mapping is obvious — “PostgreSQL” to SQL, “Kubernetes” to containers, “RLHF” to deep learning — and 62% of mentions map. The rest are the point: what ads keep asking for that the vocabulary has no question for, ranked by how many jobs require it.
A weekly review reads that ranking and proposes additions; a human accepts or rejects, because adding a skill re-scores every ad. The review of 2026-10-08:
- Accepted — software engineering (250 jobs), data governance (170), APIs and integration (118), responsible AI (64).
- Rejected — “problem-solving” (266 jobs) and English and German (434 between them) are traits and languages rather than skills; “data science” (207) is the name of the field.
Adding “software engineering” overturned one of this page’s own findings: before it was tracked, Data Scientist and AI Engineer appeared to share no core skill at all. Every figure regenerates whenever the vocabulary moves (vocabulary as of 2026-10-14).
RQ2 · The classic data science definition no longer fits
Does the classic data science definition still describe what employers advertise?
The classic data science definition is a 2010 diagram by Drew Conway (Conway 2010): three overlapping circles — coding ability, maths and statistics, and expertise in the subject being analysed — with data science in the middle, and a “danger zone” where coding met subject expertise without the statistics to know whether a result means anything.
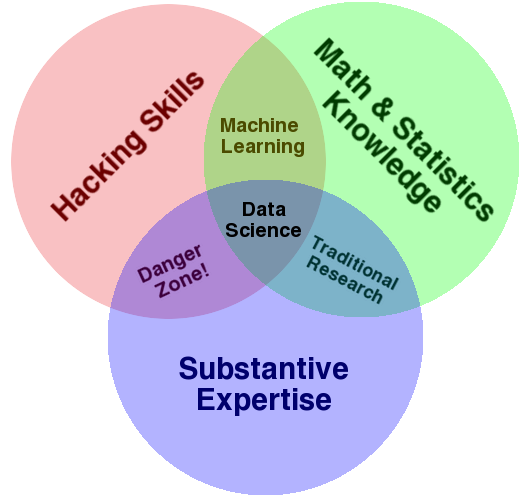
Where the classic data science definition comes from
In October 2012 Harvard Business Review called data scientist the sexiest job of the 21st century (Davenport and Patil 2012), describing a hybrid of hacker, analyst, communicator and trusted adviser. The field has drawn that hybrid three ways.
1. Conway, 2010 — what you must know. Three circles of knowledge with data science in the middle, shown above. The only one of the three that can be tested against a job ad, because employers advertise for knowledge.
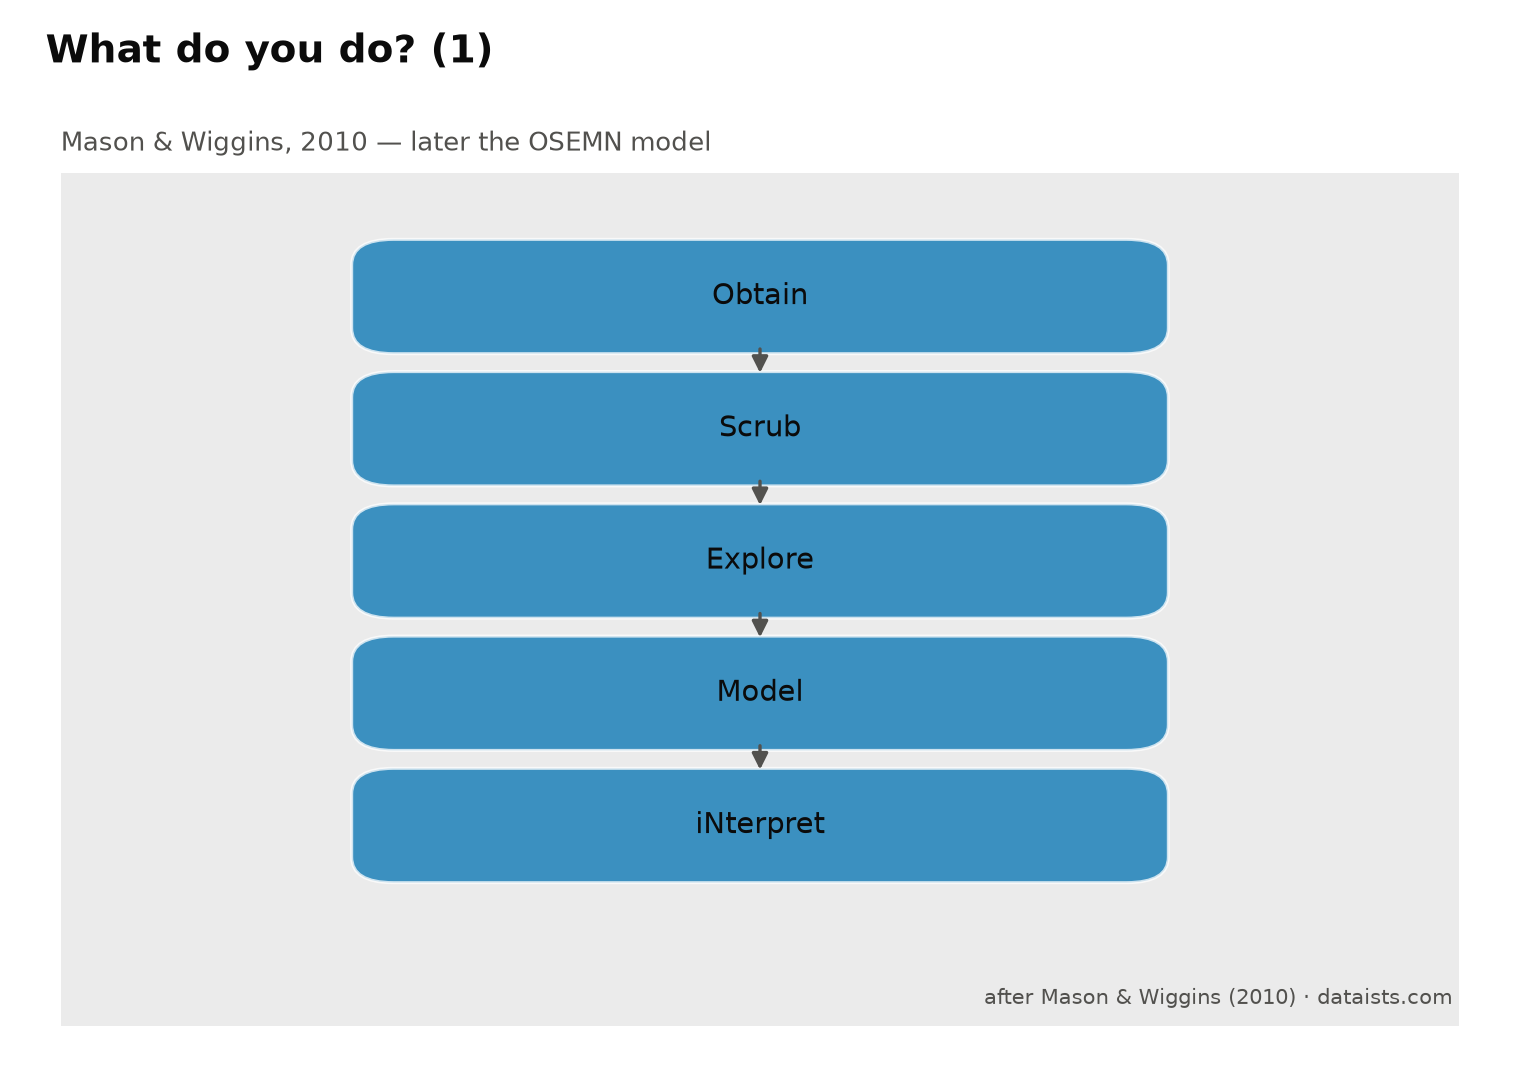
2. Mason & Wiggins, 2010 — what you do, as five steps (Mason and Wiggins 2010). Published the same month as Conway, and a description of a process rather than a person; they coined OSEMN in the same post. Their line on the least glamorous step has outlasted the rest — scrubbing data is “the least sexy part of the analysis process”.
3. Wickham, Çetinkaya-Rundel & Grolemund — what you do, as a loop. The R for Data Science cycle (Wickham, Çetinkaya-Rundel, and Grolemund 2023): import and tidy once, then loop through transform, visualise and model, then communicate, with programming underneath. Jeroen Janssens (Janssens 2021) adopts Mason and Wiggins’s steps as the spine of Data Science at the Command Line.
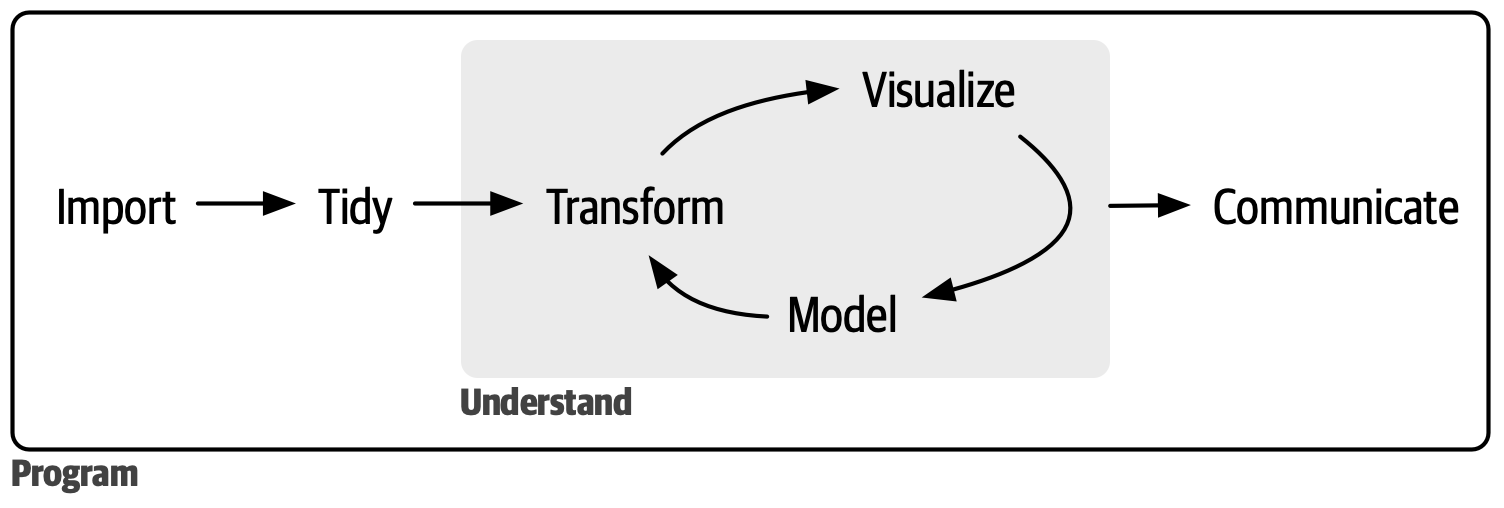
All three are definitions of the same job from the same era, and the first is the one with a testable shape. Measured against these job ads, Conway’s three circles do not hold. A job ad counts inside a circle when it requires at least one skill mapped to that circle.
31% of job ads want coding and subject expertise but no statistics — the region Conway marked “danger zone” and thought nearly empty. 7 tracked skills fit none of his circles at all, and 50% of ads require at least one.
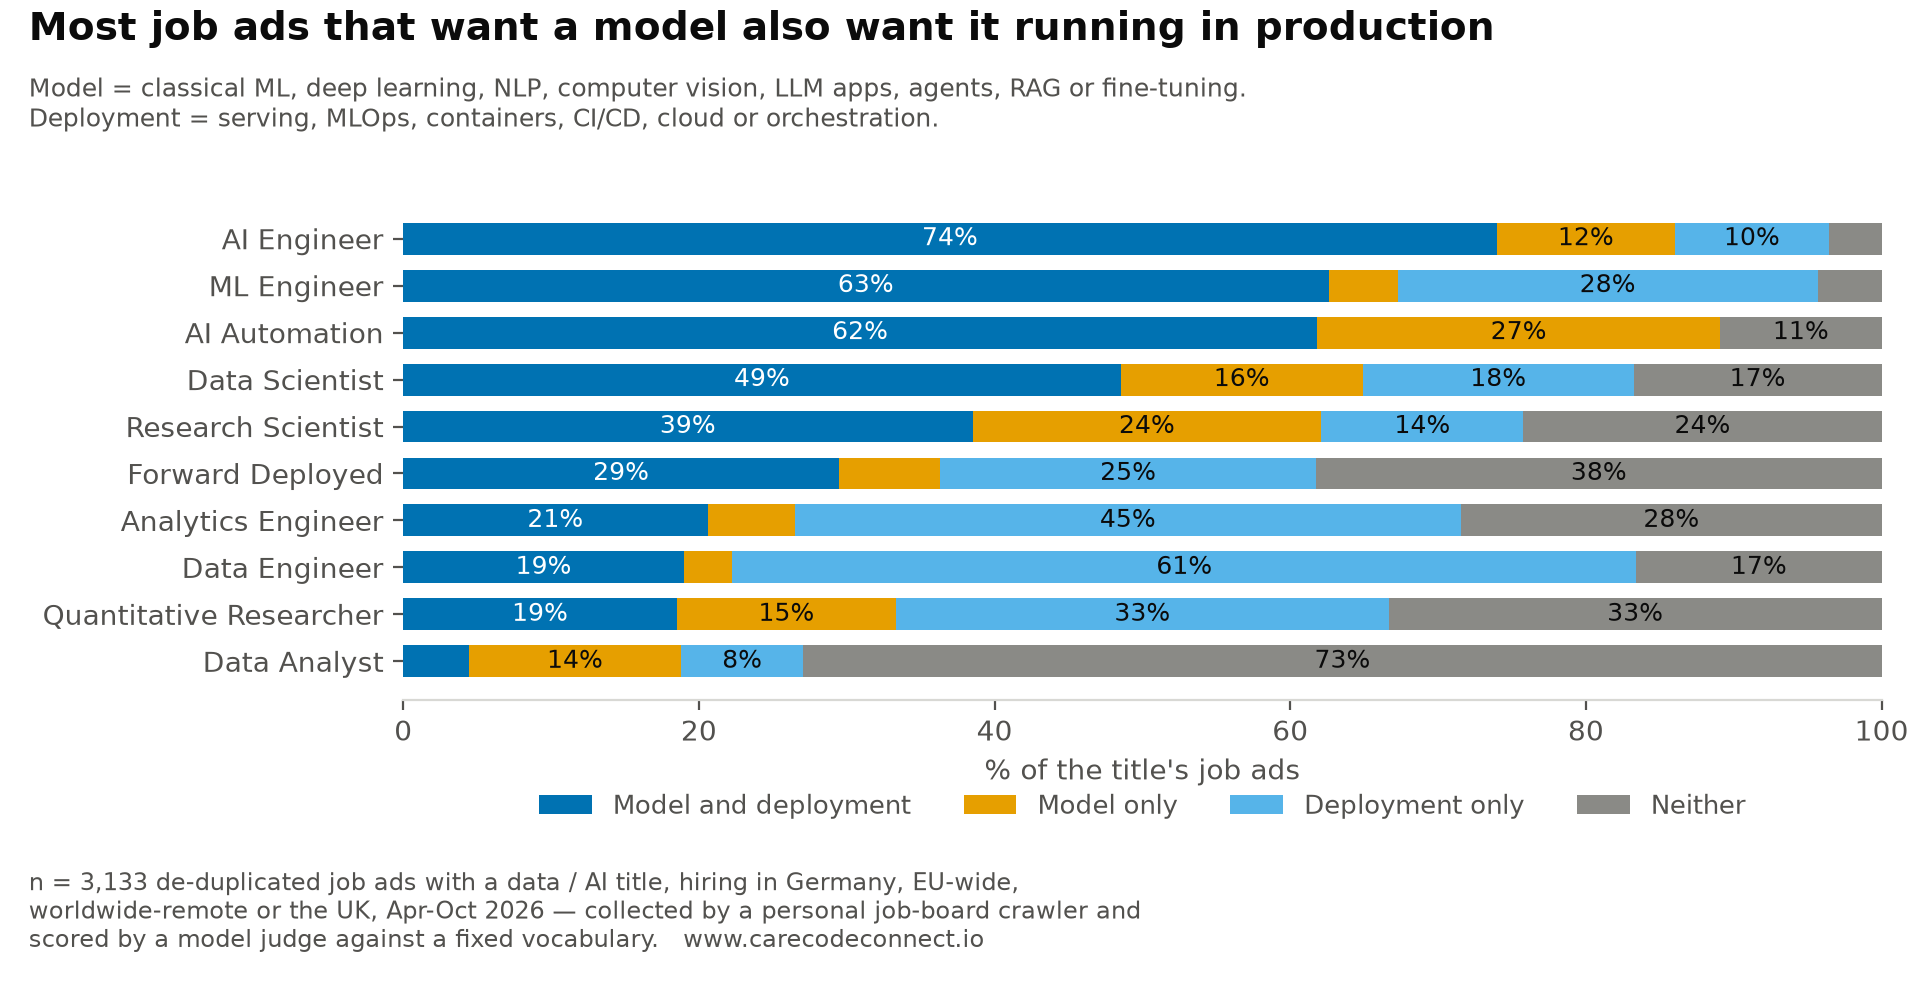
What the definition has no room for is deployment. Its three circles are kinds of knowledge — coding, maths, subject expertise. 67% of ads require a production skill, and model serving alone appears in 59% of Data Scientist ads, more than any single modelling skill.
A Data Scientist ad asks for the model and for running it. 49% require both modelling and deployment, and of those requiring modelling, 75% require deployment too. The ad wanting a model but not its deployment is 16%.
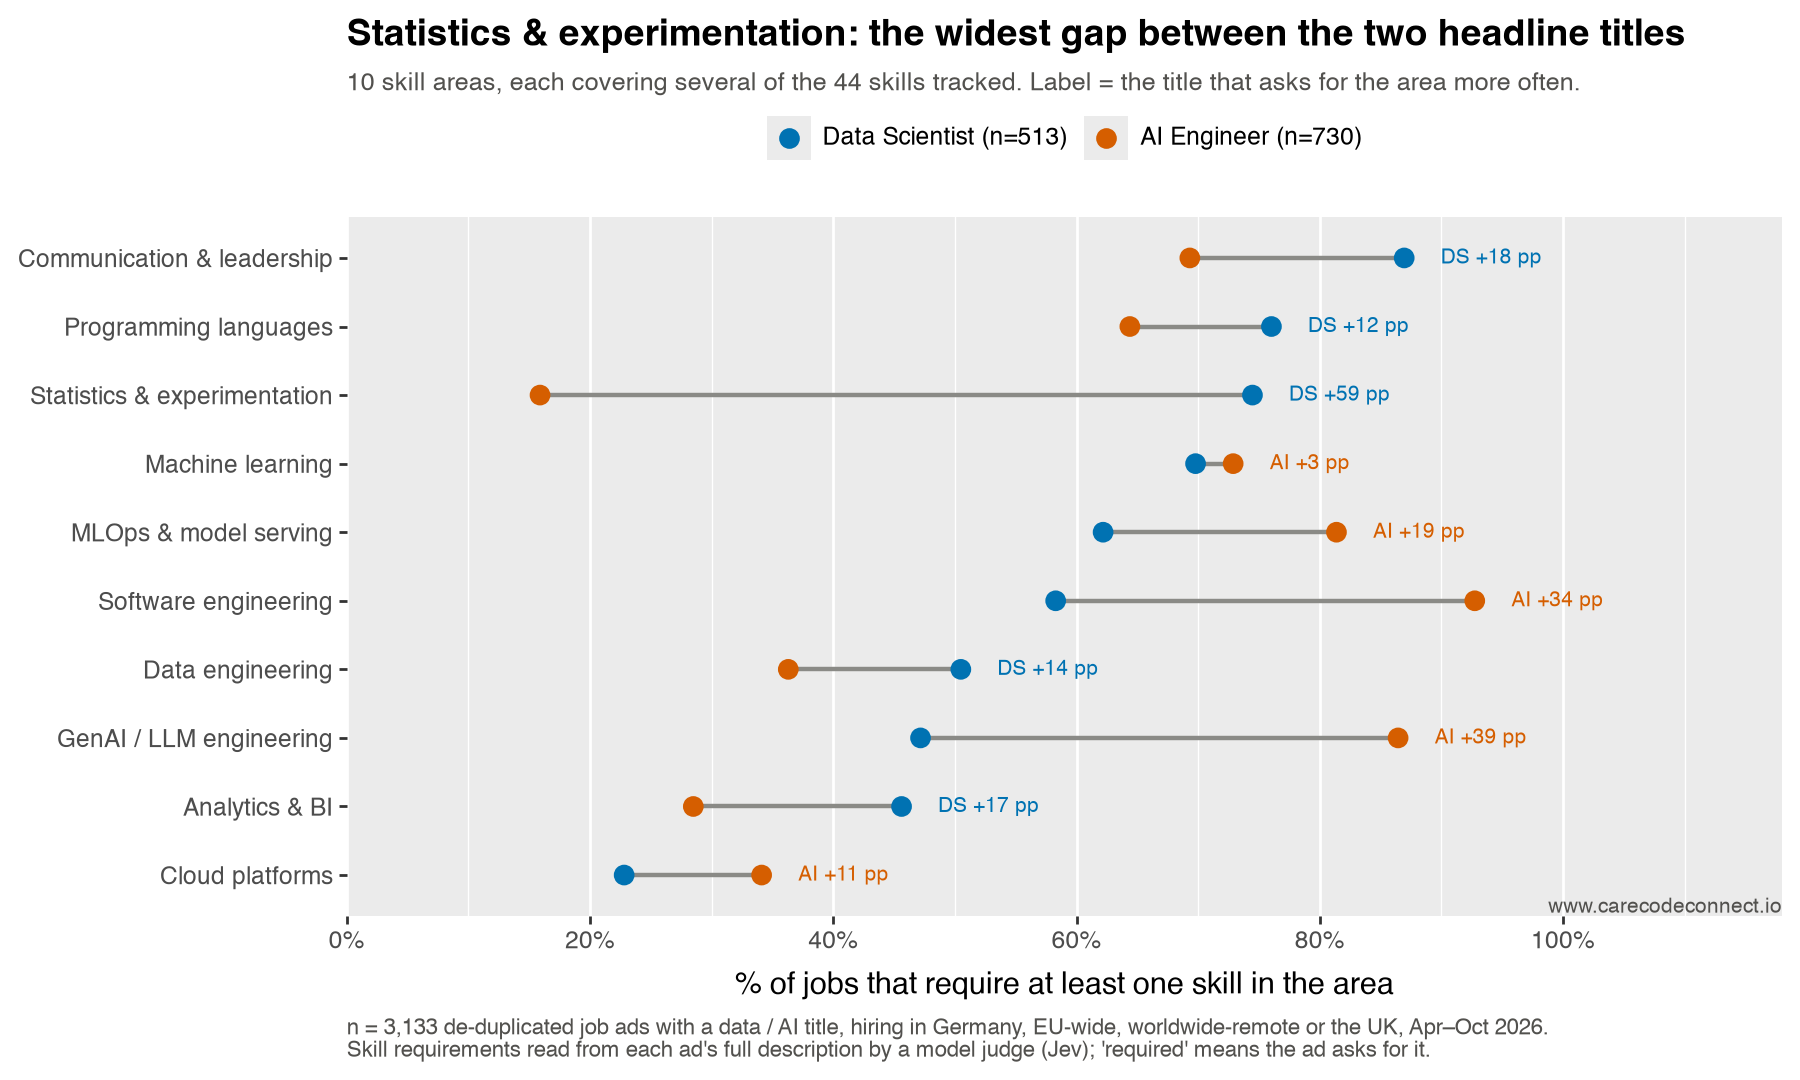
Statistics separates the two headline titles: 73% of Data Scientist ads against 11% of AI Engineer ads. It is the title, not the level: compared within each seniority level the gap is 62 points at mid, 62 at senior and 63 at staff or principal — so it is not that one title is advertised more senior than the other. On full requirement profiles they are 1.43 apart — further than Data Scientist is from Data Analyst (1.29) — with ML Engineer the shortest link between them (1.11 and 1.06).
RQ3 · Each region belongs to a different title
How do the 10 titles divide that work between them?
The centre — ads needing all three groups — is 35% of the market, and 72% of it carries a title other than Data Scientist. Data-platform work belongs to Data Engineers, engineering without inference to AI Engineers, data-and-inference without engineering to Data Analysts (55% of that region).
A bird’s-eye view: how the titles sit relative to each other
Each title’s profile is the share of its ads requiring each skill; an edge is the Euclidean distance between two profiles.
The closest pair on the map is AI Automation and AI Engineer at 0.75 — the automation titles ask for very nearly what AI Engineer ads ask for. Data Engineer and Analytics Engineer are next at 0.95, and reach the rest of the market only through Data Analyst. Data Scientist, AI Engineer and ML Engineer share 5 required skills — Python, mentoring / leadership, model serving, software engineering, stakeholder communication — and beyond those, Data Scientist and AI Engineer have nothing in common.
By skill area:
- Statistics and experimentation is the widest split — 74% of Data Scientist ads against 16% of AI Engineer ads.
- GenAI / LLM engineering is its mirror — 47% against 86%.
- Machine learning itself is nearly even — 70% against 73%.
Where AI Engineer comes from: its nearest neighbour is ML Engineer (1.06), and Data Engineer is 1.91 away — further than Data Scientist. One skill crosses the divide: model evaluation is required in 45% of AI Engineer ads and 23% of Data Scientist ads, against 2% of Data Engineer ads. Within the 1,008 engineering ads, evals run at 43% overall but 78% where A/B experimentation is also required (odds ratio 5.5, p <0.001). LLM observability shows no such link (odds ratio 0.7, p 0.22).
Each dot is one job ad, placed by the 44 skills it requires (t-SNE (Maaten and Hinton 2008): nearby dots have similar requirements, and distances across the map carry no scale). Click a title in the legend to hide it.
WarningOne known limitation: is machine learning simply assumed?
Partly. Of the 397 ads the judge classes as data science, 163 never write machine learning, deep learning or neural network — but 23% of those (37 ads) name a technique or tool that unmistakably is one: predictive modelling (11 ads), classification (10), regression (10), PyTorch (7), regression analysis (7), scikit-learn (6), clustering (6), MLflow (5), feature engineering (5), TensorFlow (4). For those, the skill is implied rather than stated, and counting the literal phrase understates it. Counting those as machine learning raises the second pass’s figure from 59% to 68%, against the 46% that Jev scores as required — the gap between naming a thing and requiring it.
The remaining 126 ads name neither the concept nor any of its tools. They ask instead for Python, SQL, data science, causal inference, A/B testing, communication, R — an experimentation and analytics profile rather than a modelling one.
Population note: this check selects on the judge’s role-family answer rather than the title regex used elsewhere on the page, so its n differs from the Data Scientist title count by design.
Deep dive into skills by role title
10 titles, in the approximate order each entered data and AI hiring. The dates are background — this sample runs 2026-04 to 2026-10 and can say nothing about when a title appeared — but everything after them is measured from the ads.
Across the whole sample, 27% of ads require building or training a model of some kind and 41% require calling a model someone else trained. That split is the thread running through these sections, and it moves with the chronology: the older the title, the likelier it is to build.
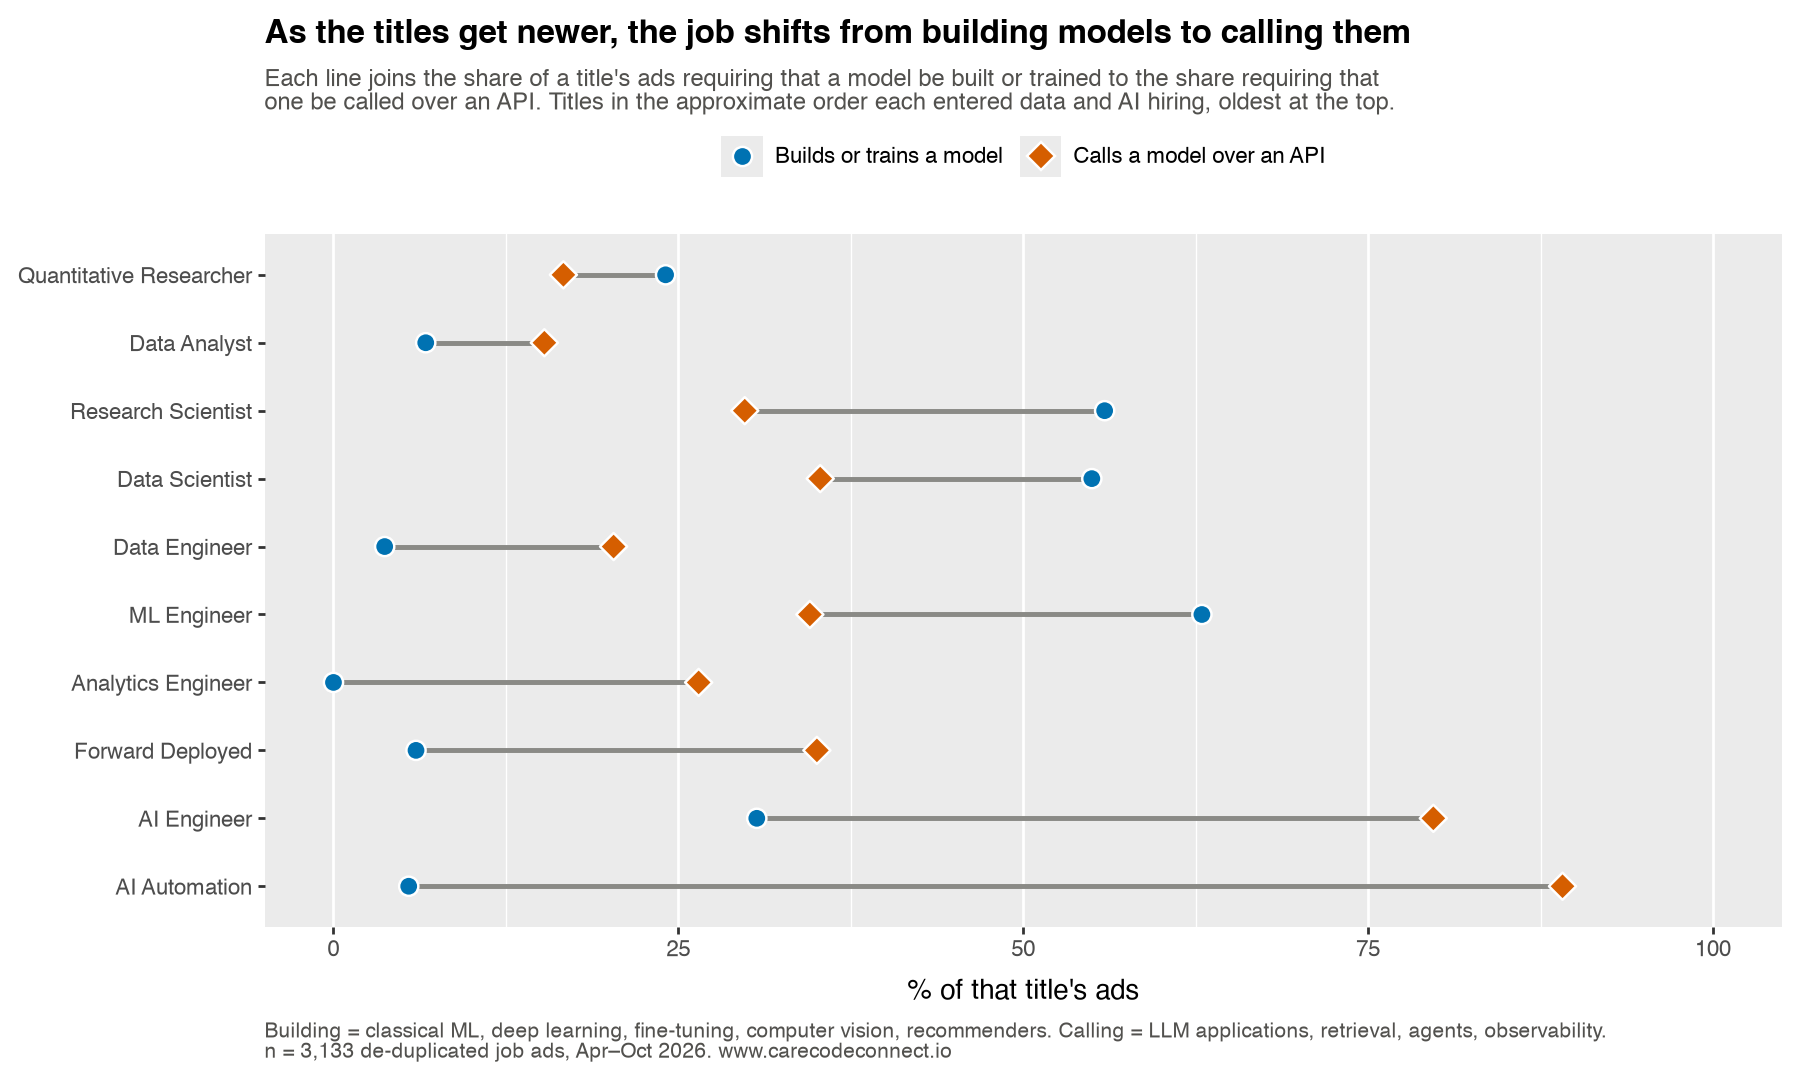
Each of the 10 titles is below, in broadly chronological order — approximately when each title began appearing in data and AI hiring, oldest first. The dates are background, not measured: this sample runs 2026-04 to 2026-10 and can say nothing about when a title appeared. Everything inside each title is measured from the ads. Open a title to see what its ads require, the phrases they use, and its nearest neighbours on the skills map.
Note1. Quantitative Researcher
finance, 1980s–1990s · 54 ads, 2% of the sample
The oldest title here, and the one that got there first. Investment banks and hedge funds were hiring mathematicians and physicists to price derivatives and find trading signals two decades before anyone said “data scientist”. Everything the later titles claim as novel — statistics on large datasets, models in production, money riding on the output — was already the job.
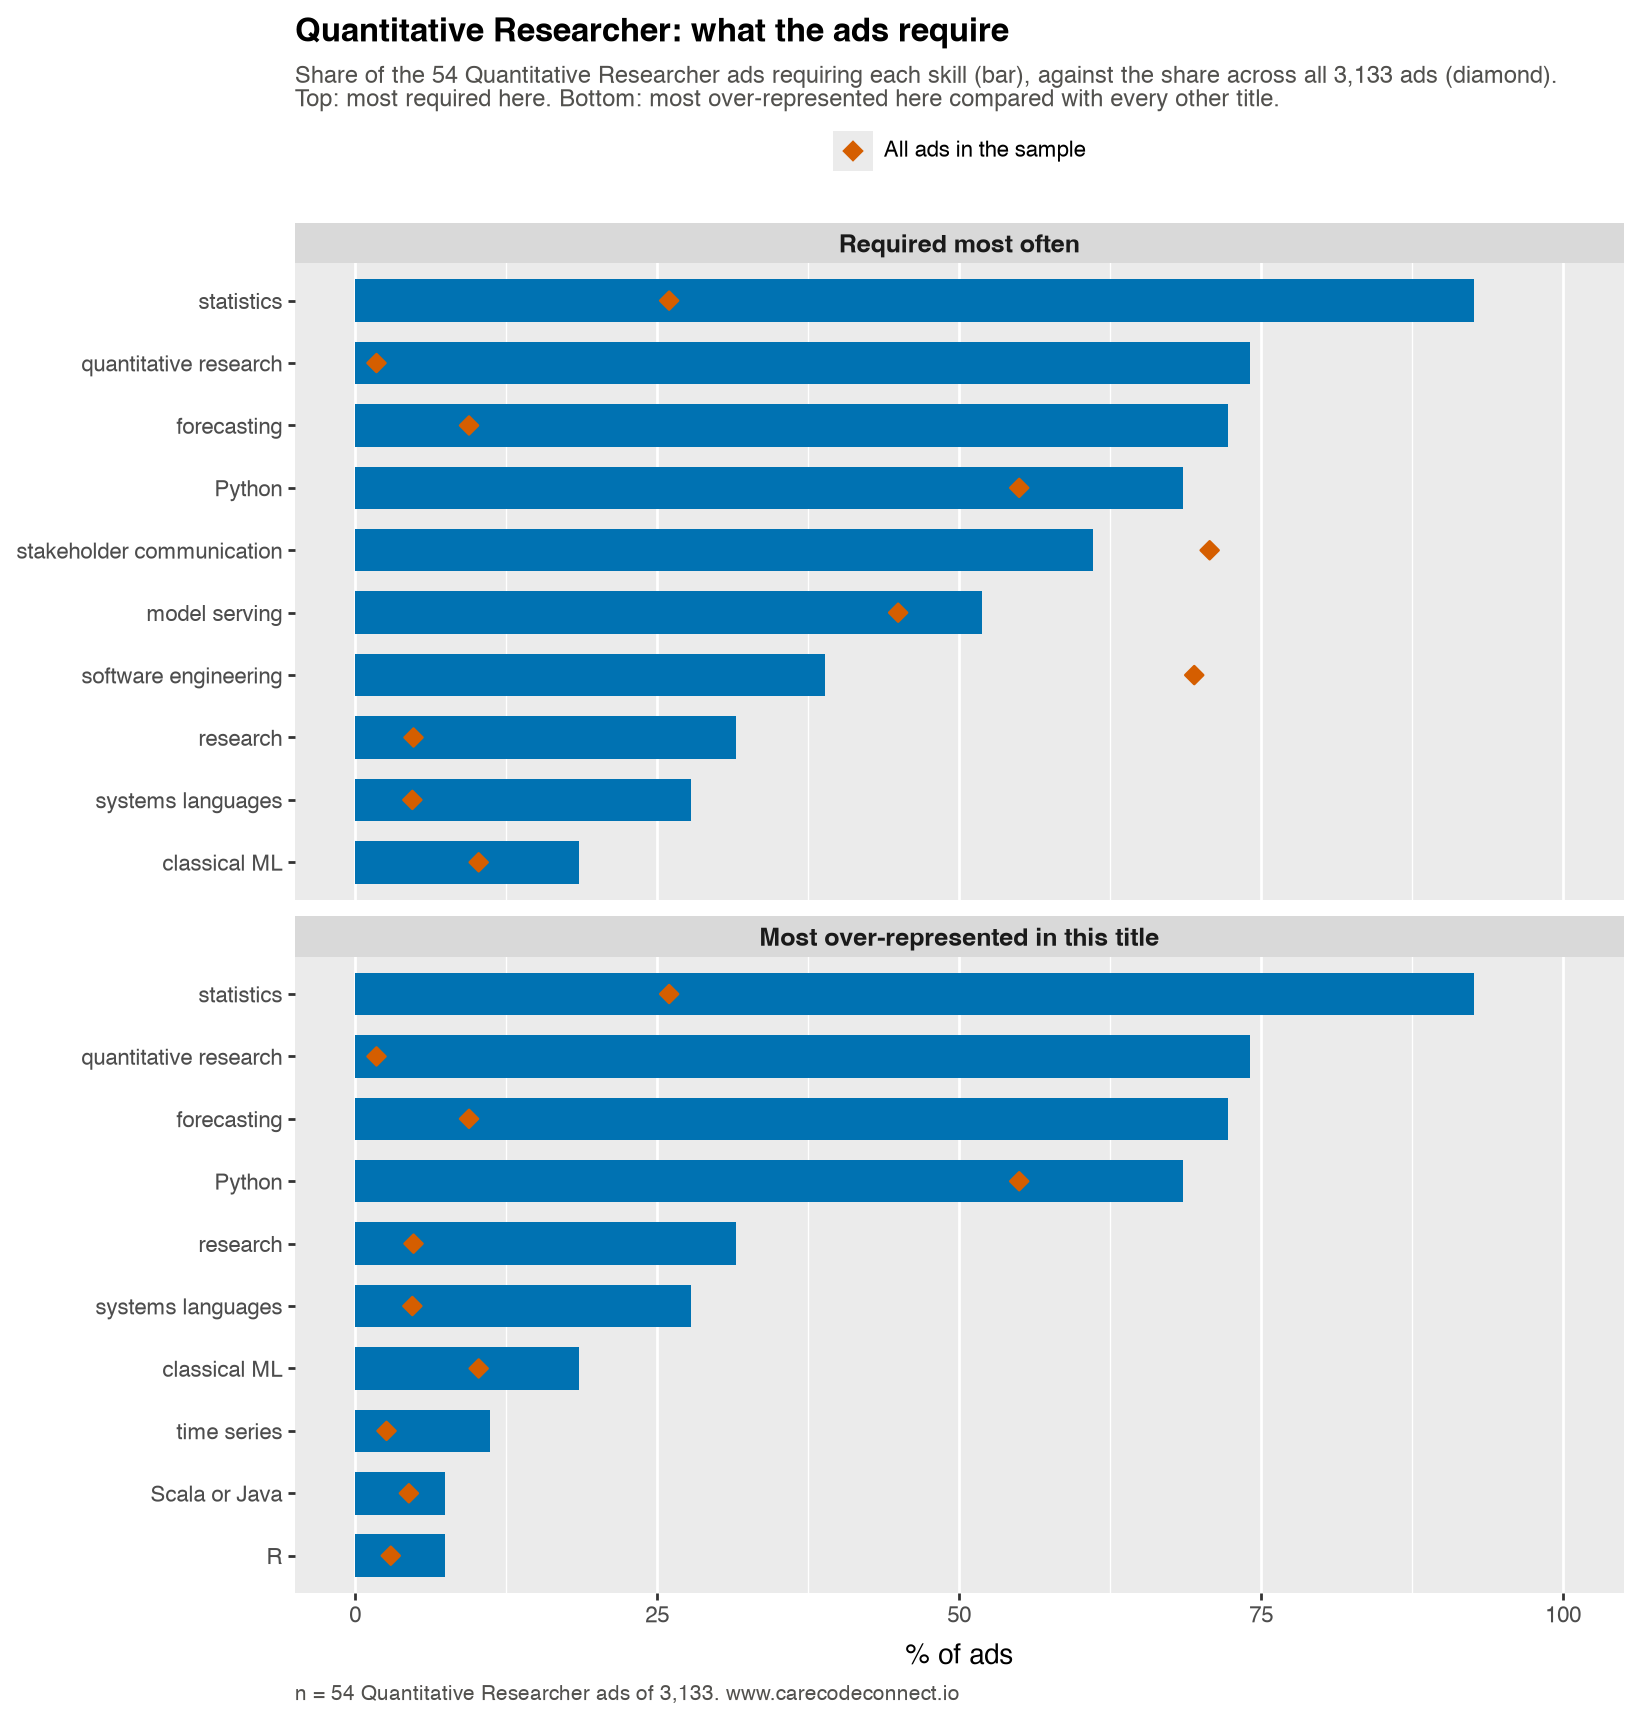
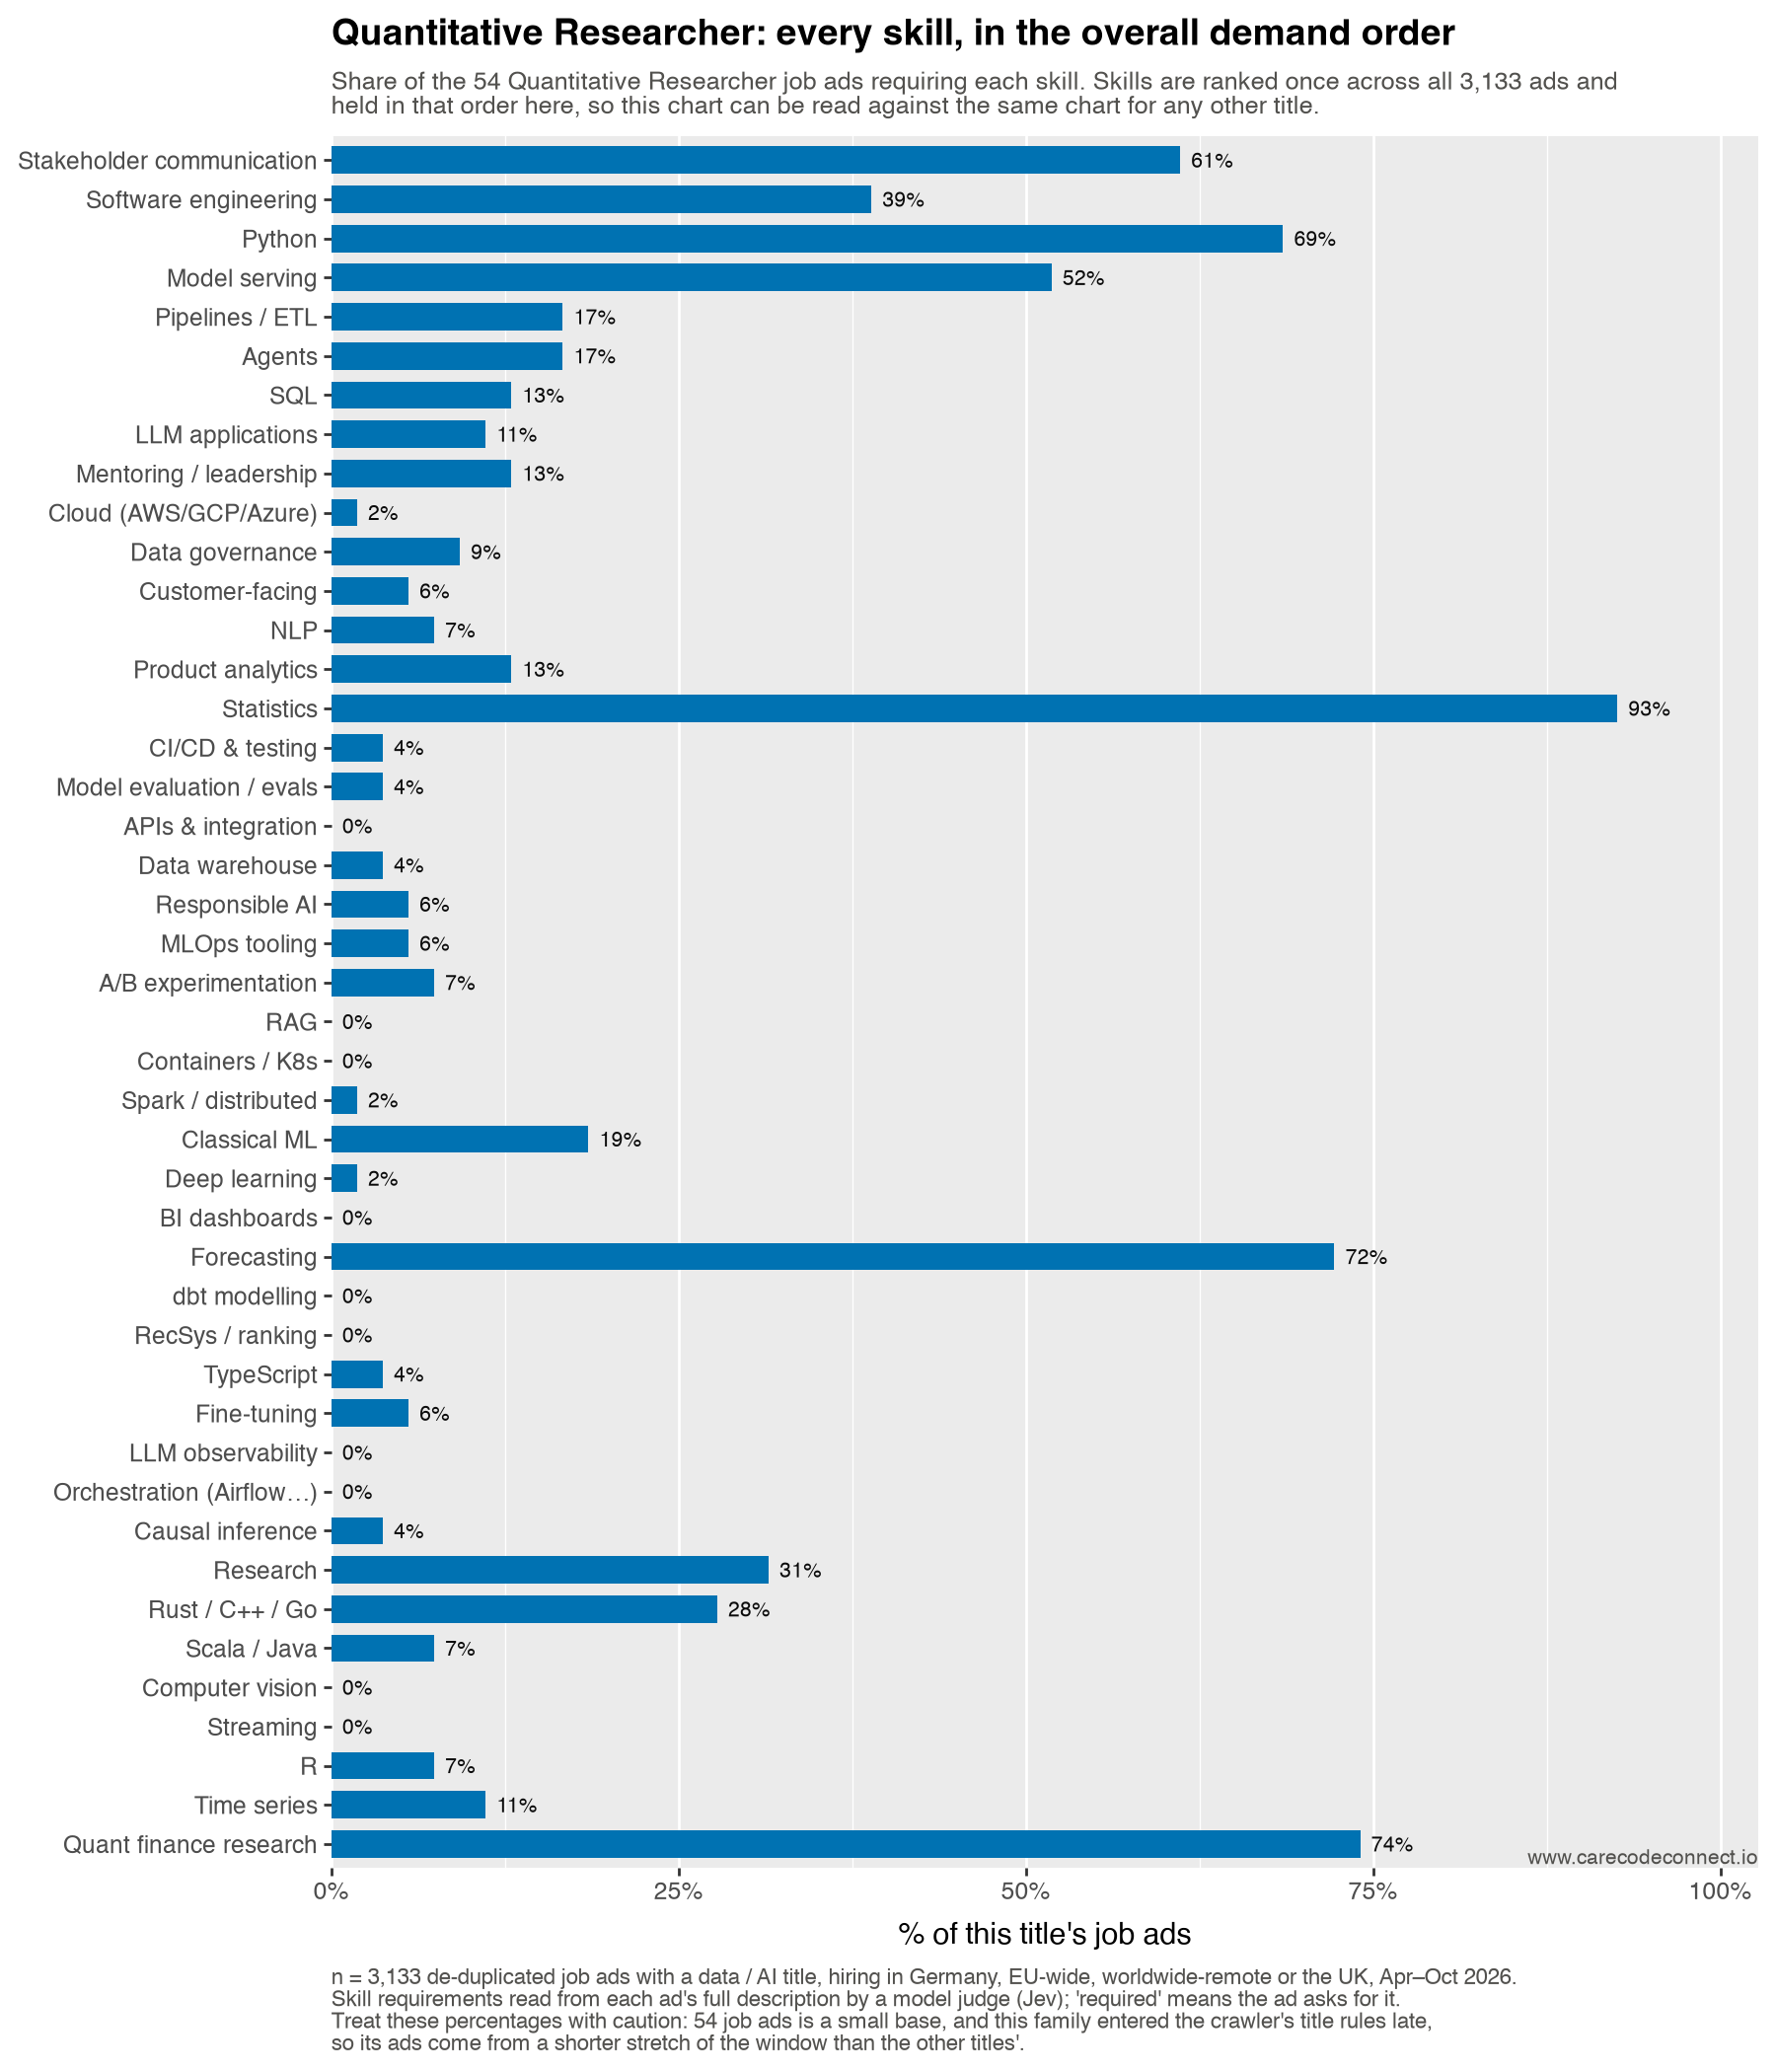
Read these percentages with caution. 54 job ads is a small base: a single ad moves any figure here by about 2 points. It is a rare title in this pool rather than a late-admitted one, so the base is small but the window is the same as every other title’s.
Take-home. 19% of these ads want both a model and its deployment and 15% a model without it; the most distinctive requirement is quantitative research, and the nearest title is Data Scientist.
Nearest neighbour. Data Scientist (1.33 apart on the skills map), then Research Scientist (1.45). Furthest: Analytics Engineer (2.39).
Build or call. 24% build or train a model, 17% call one over an API, and 9% want the API work with no model-building at all.
In the ads’ own words. The phrases most over-represented in this title, read out of the ads by a second model that was never shown our skill list, with the share of the title’s ads using each: “portfolio construction” (7%), “derivatives pricing” (6%), “high-frequency trading” (6%), “large dataset analysis” (9%), “quantitative modeling” (11%).
5+ years of experience with quantitative modeling and pricing
— one of 6 Quantitative Researcher job ads (11% of the title) that ask for “quantitative modeling”
Strong understanding of market mechanics and microstructure invariants
— one of 5 Quantitative Researcher job ads (9% of the title) that ask for “market microstructure”
Note2. Data Analyst
business intelligence, 1990s–2000s · 314 ads, 10% of the sample
Grew out of business intelligence and reporting. The job was to turn a company’s own operational data into numbers a manager could act on, and the tooling was the warehouse and the dashboard rather than the notebook.
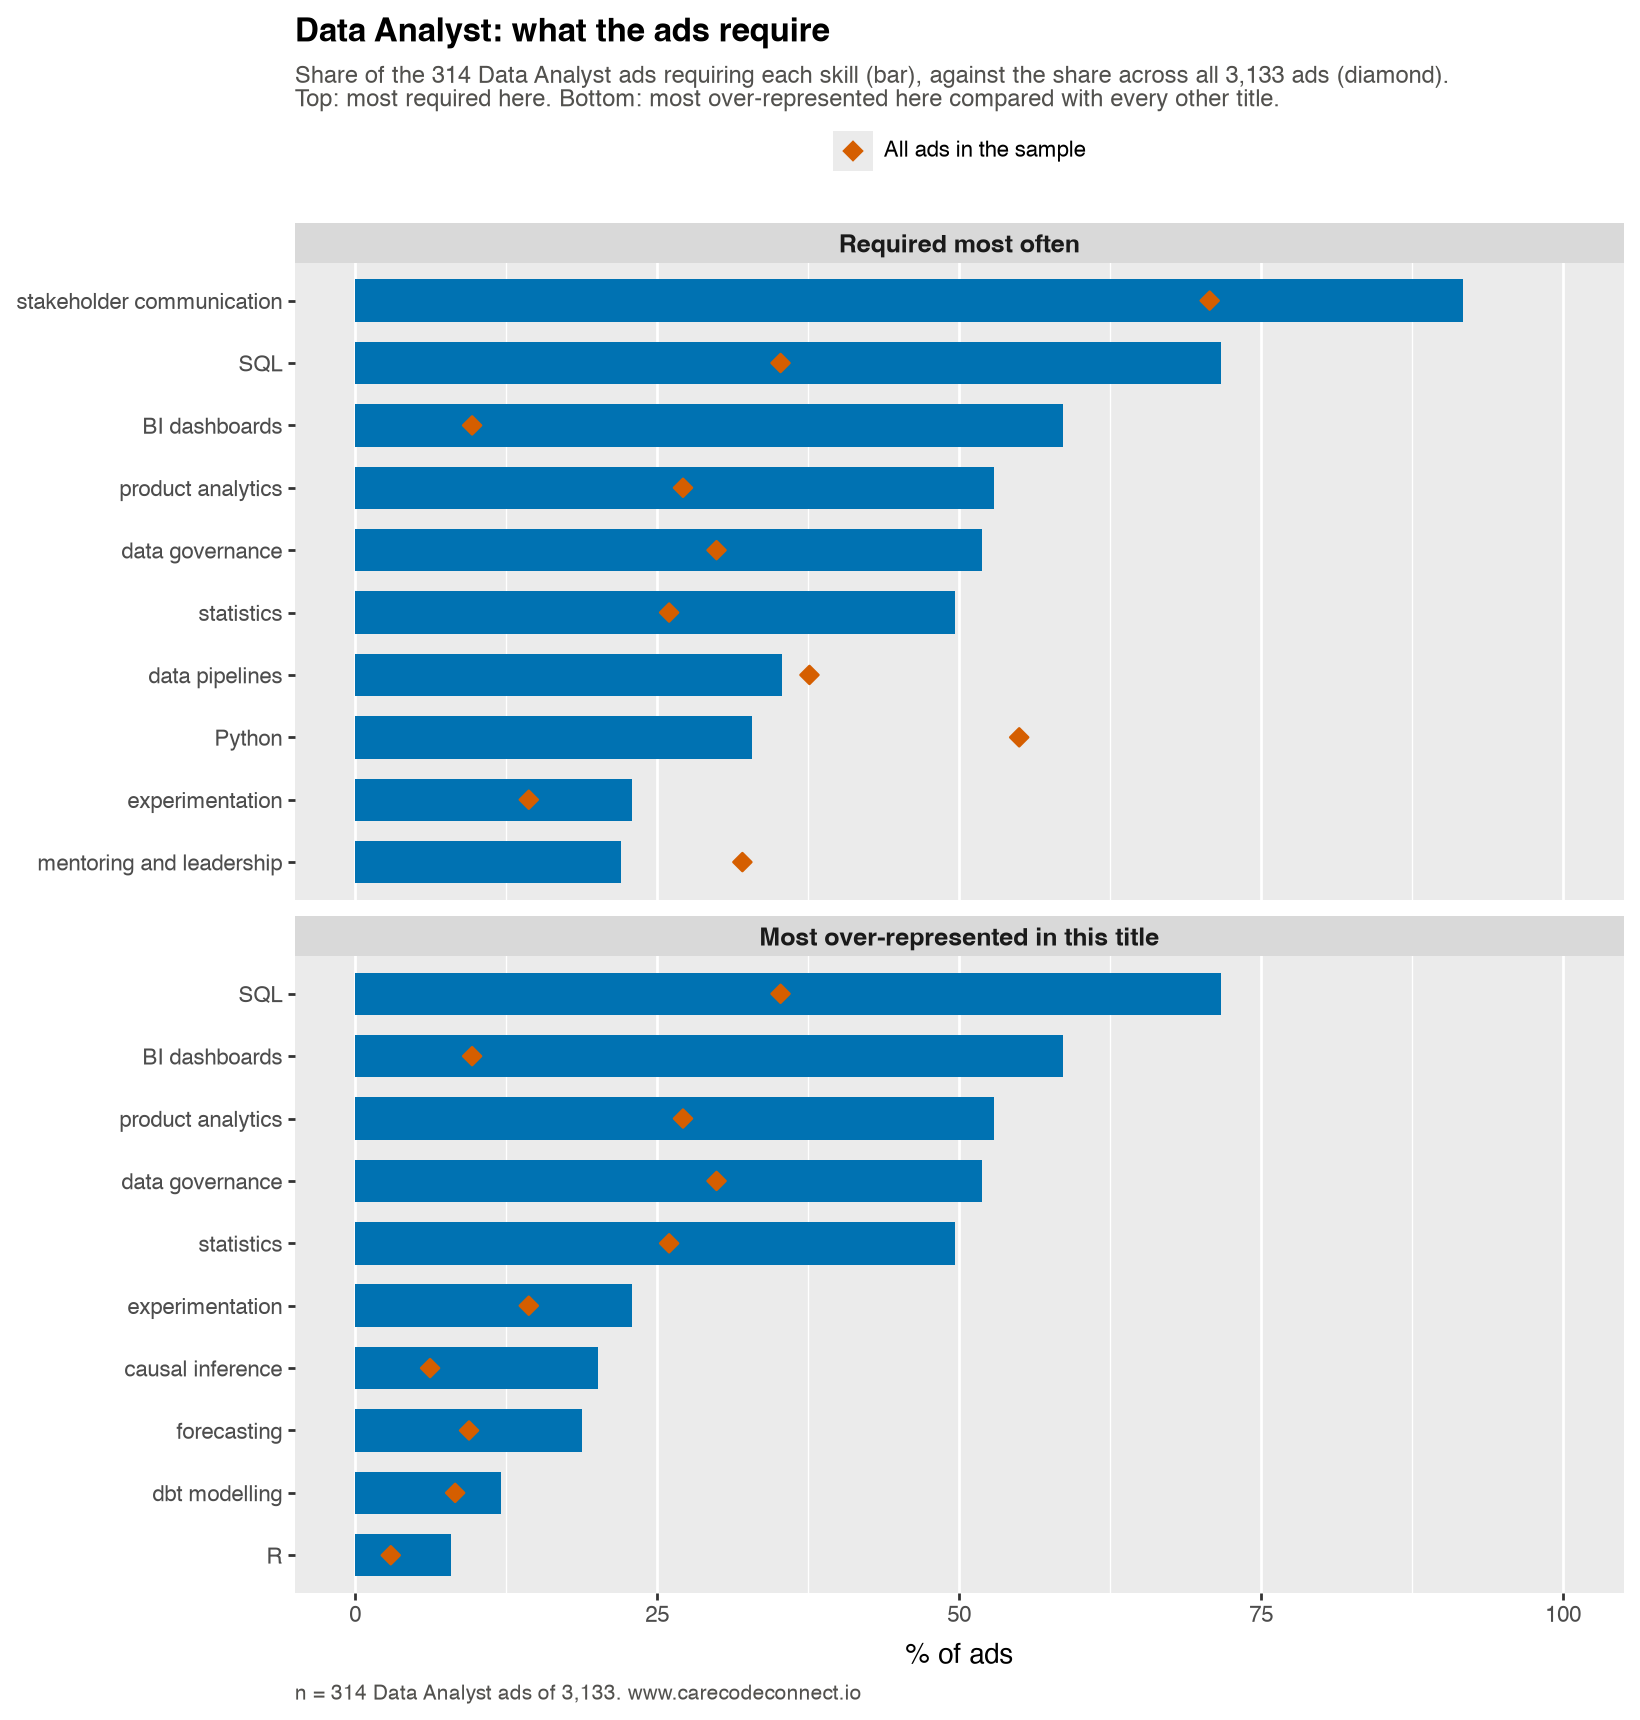
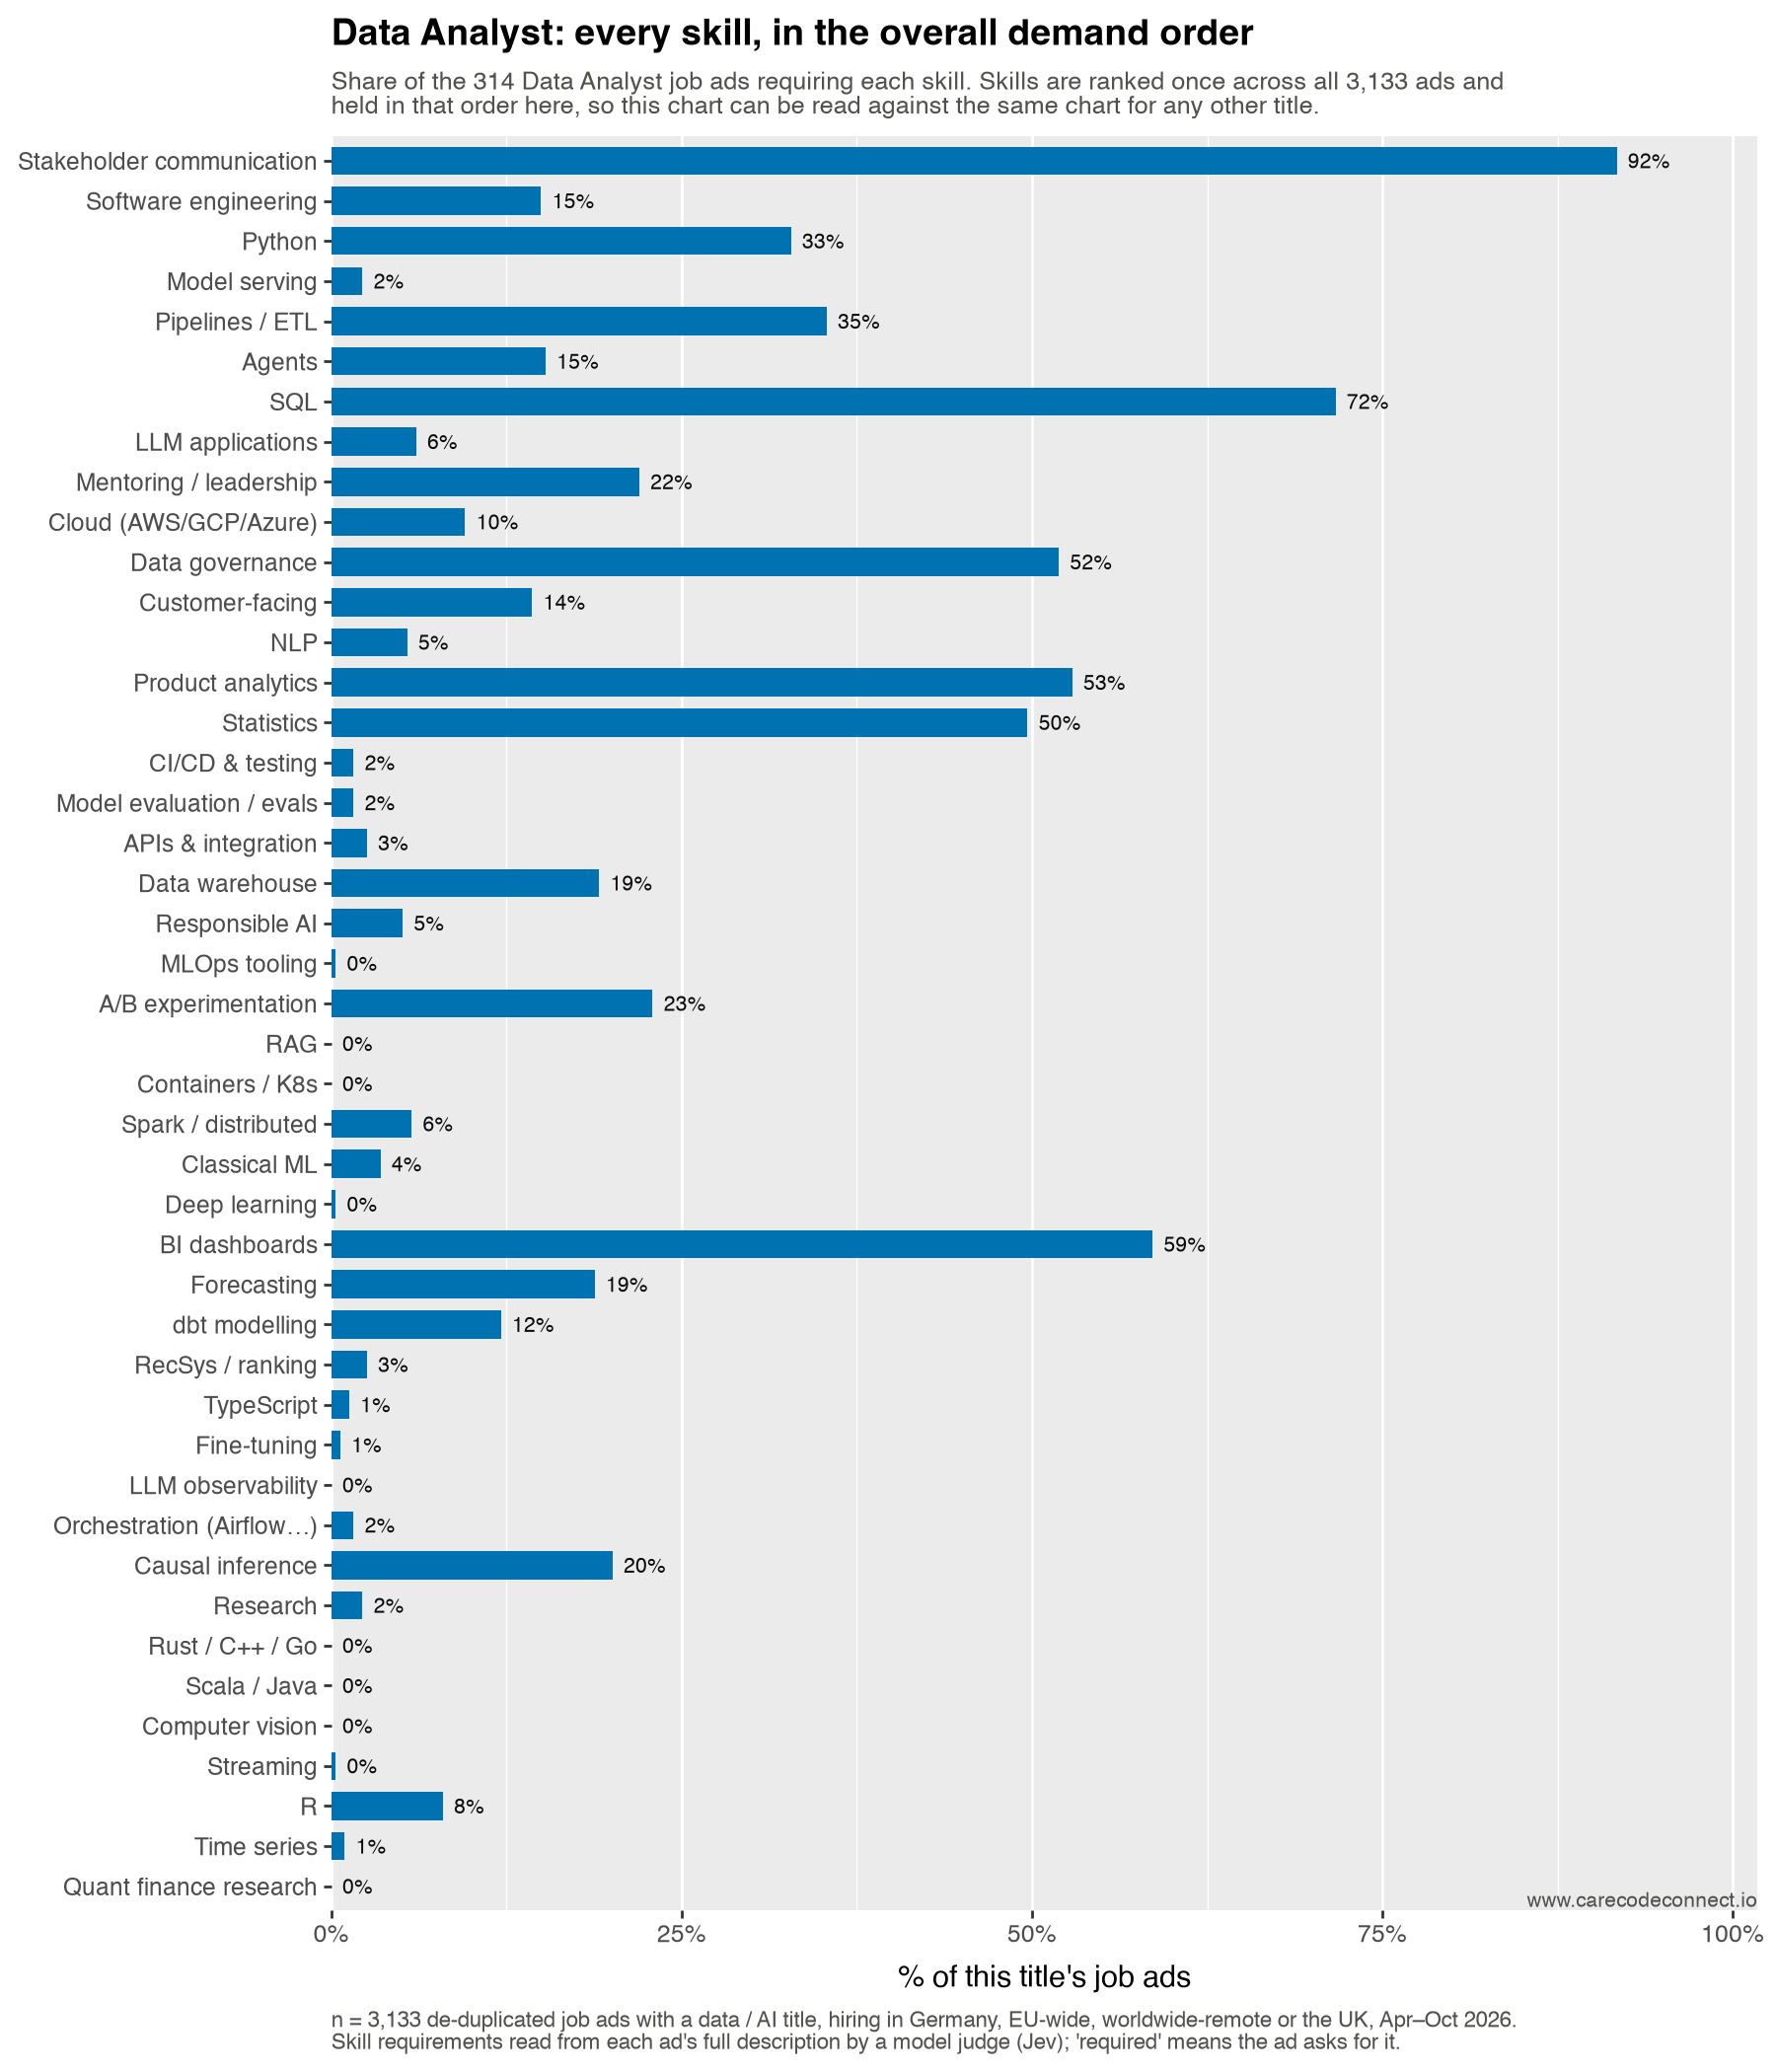
Take-home. 4% of these ads want both a model and its deployment and 14% a model without it; the most distinctive requirement is BI dashboards, and the nearest title is Data Scientist.
Nearest neighbour. Data Scientist (1.29 apart on the skills map), then Analytics Engineer (1.47). Furthest: AI Engineer (2.09).
Build or call. 7% build or train a model, 15% call one over an API, and 14% want the API work with no model-building at all.
In the ads’ own words. The phrases most over-represented in this title, read out of the ads by a second model that was never shown our skill list, with the share of the title’s ads using each: “dashboard design” (8%), “excel” (20%), “cohort analysis” (5%), “tableau” (31%), “power bi” (34%).
data visualisation tools such as Power BI
— one of 107 Data Analyst job ads (34% of the title) that ask for “power bi”
A/B testing that directly influence product improvements
— one of 58 Data Analyst job ads (18% of the title) that ask for “a/b testing”
Note3. Research Scientist
industrial labs, long-standing; current AI form from ~2012 · 161 ads, 5% of the sample
The title is far older than data science — industrial research labs have used it for most of a century — but the version that shows up in this sample is the deep-learning lab role that followed the 2012 ImageNet result: publish, train large models, push the state of the art.
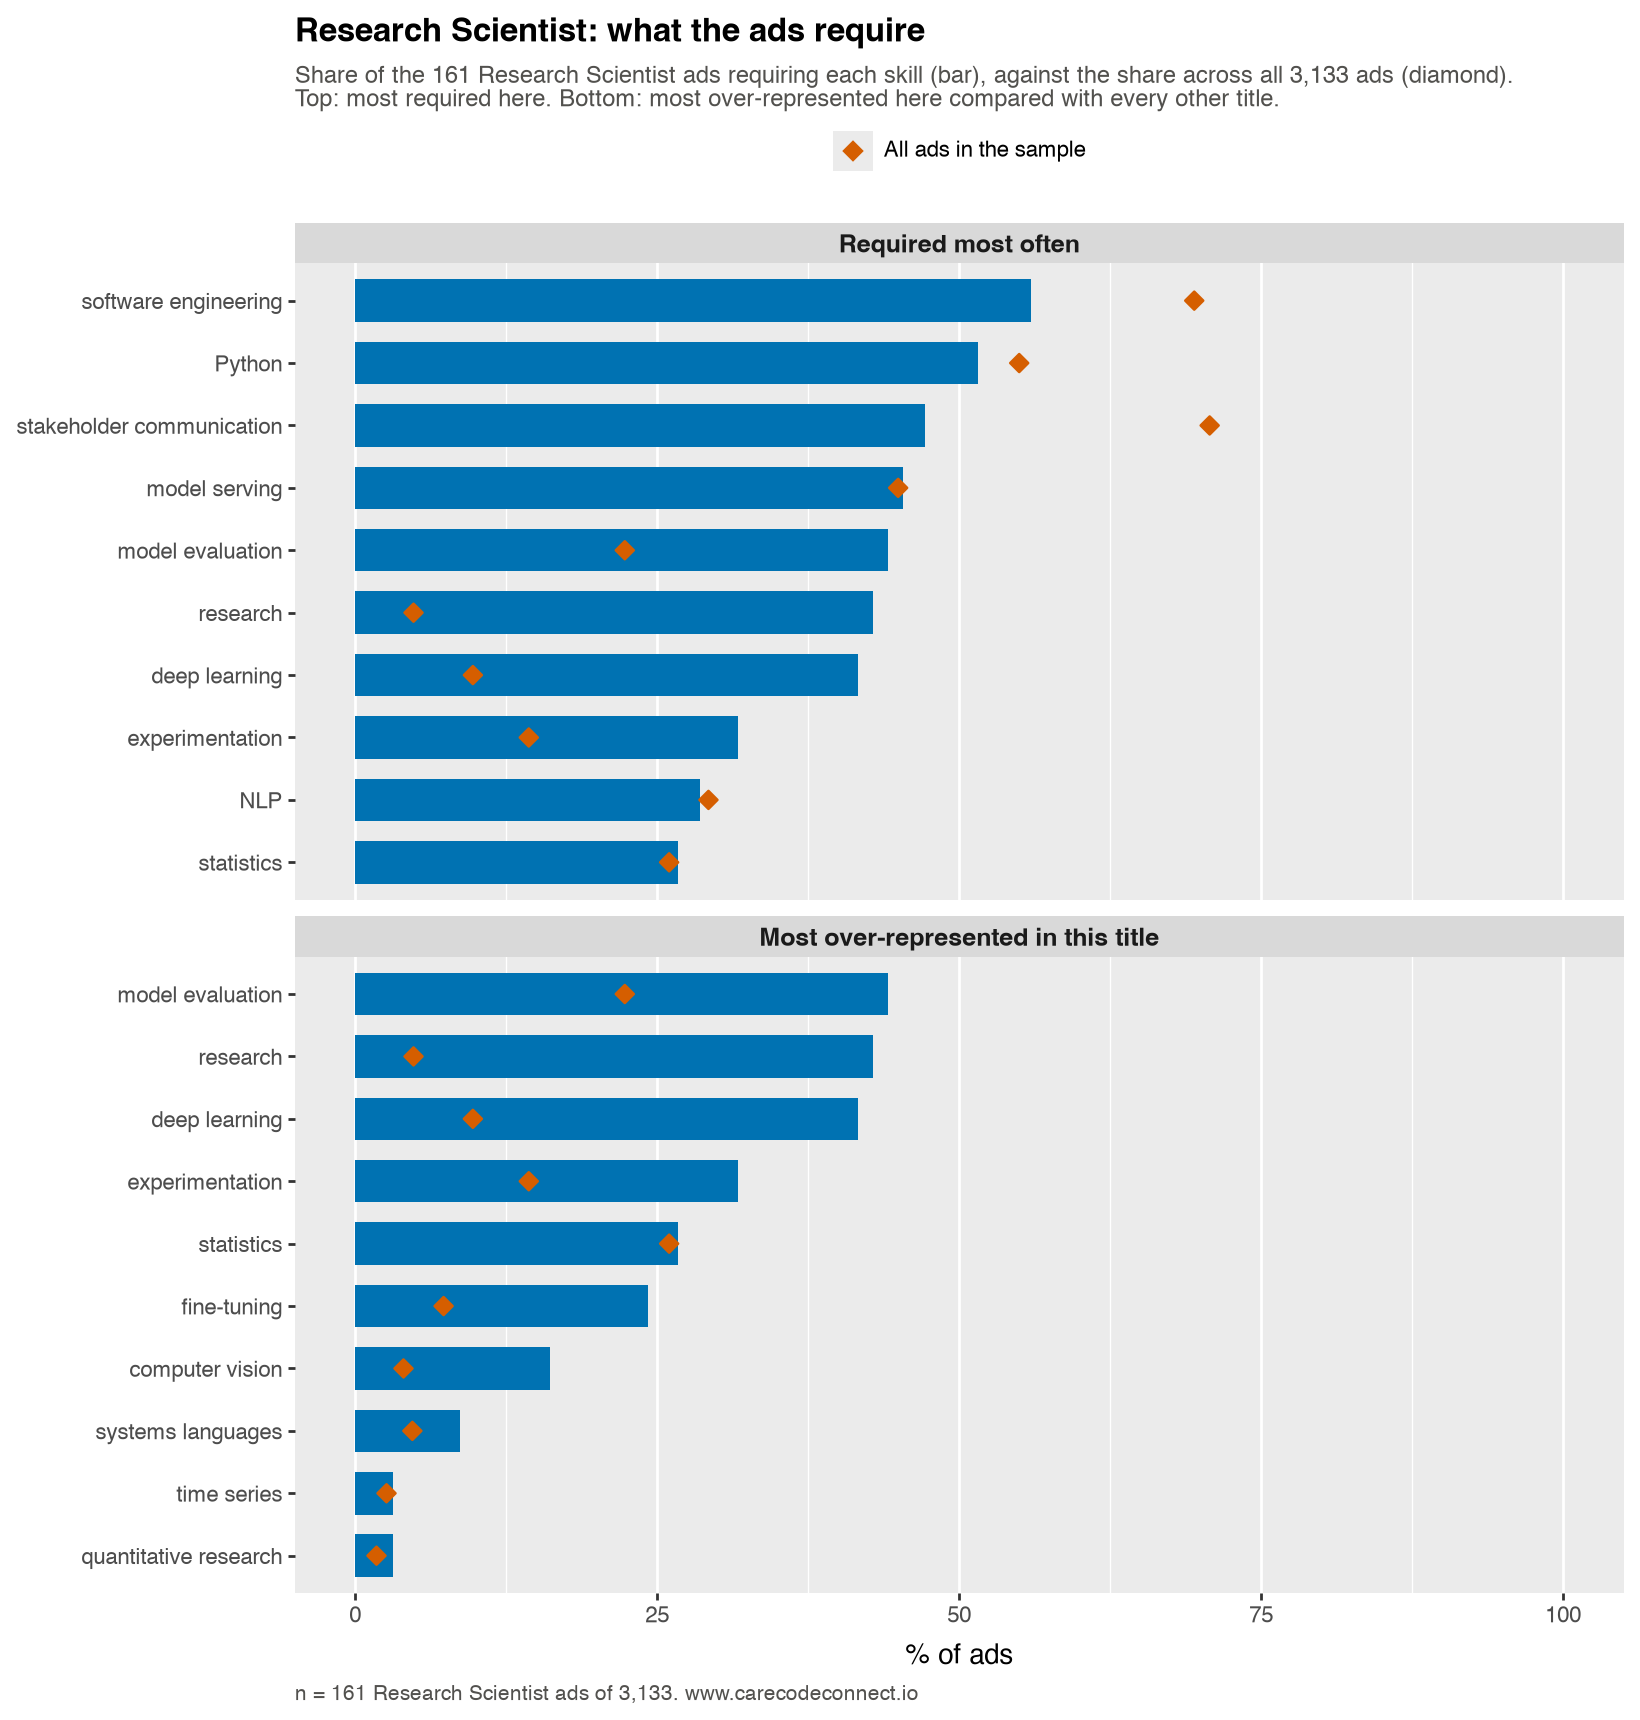
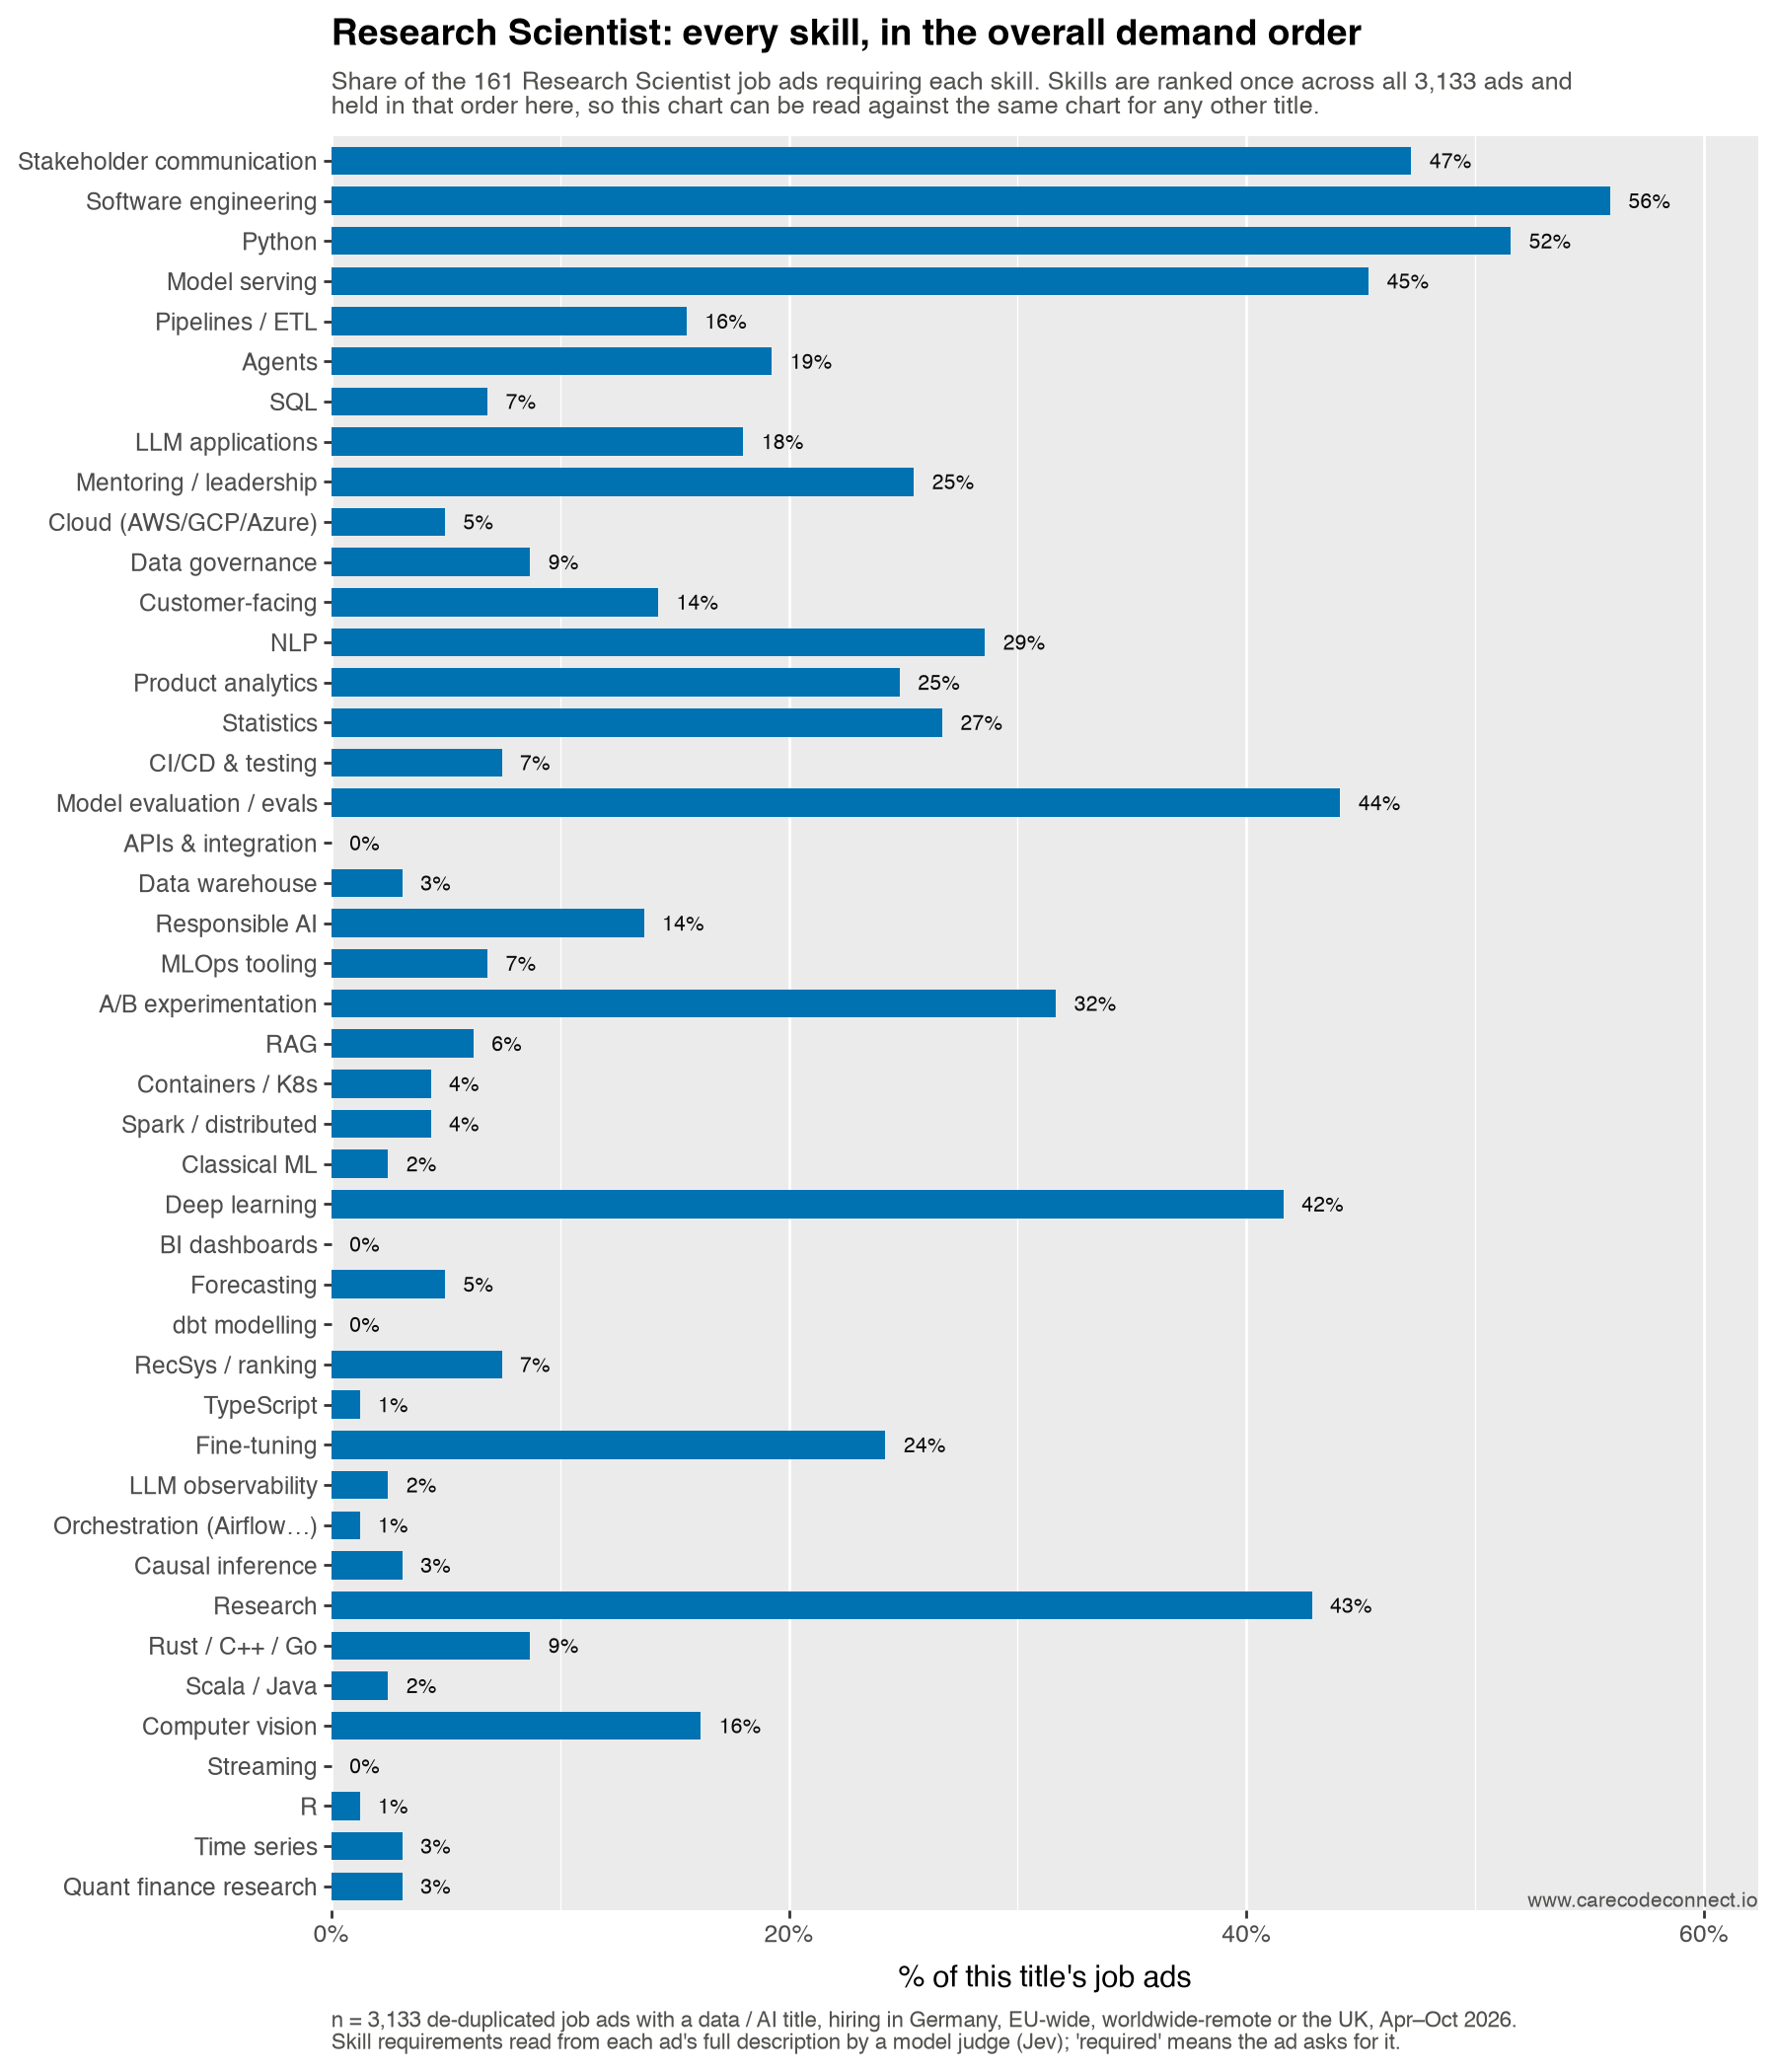
Take-home. 39% of these ads want both a model and its deployment and 24% a model without it; the most distinctive requirement is research, and the nearest title is ML Engineer.
Nearest neighbour. ML Engineer (1.02 apart on the skills map), then Data Scientist (1.18). Furthest: Analytics Engineer (2.08).
Build or call. 56% build or train a model, 30% call one over an API, and 9% want the API work with no model-building at all.
In the ads’ own words. The phrases most over-represented in this title, read out of the ads by a second model that was never shown our skill list, with the share of the title’s ads using each: “sglang” (6%), “jax” (13%), “experimental design” (12%), “reinforcement learning” (17%), “cuda” (11%).
Strong empirical research skills in Reinforcement Learning
— one of 28 Research Scientist job ads (17% of the title) that ask for “reinforcement learning”
state-of-the-art Deep Learning and Reinforcement Learning models
— one of 28 Research Scientist job ads (17% of the title) that ask for “deep learning”
Note4. Data Scientist
coined 2008, mainstream from ~2012 · 513 ads, 16% of the sample
Coined in 2008 by D.J. Patil and Jeff Hammerbacher, then leading data at LinkedIn and Facebook, and made famous by the 2012 Harvard Business Review piece. The pitch was a hybrid: enough statistics to be rigorous, enough code to be self-sufficient, enough business sense to be listened to.
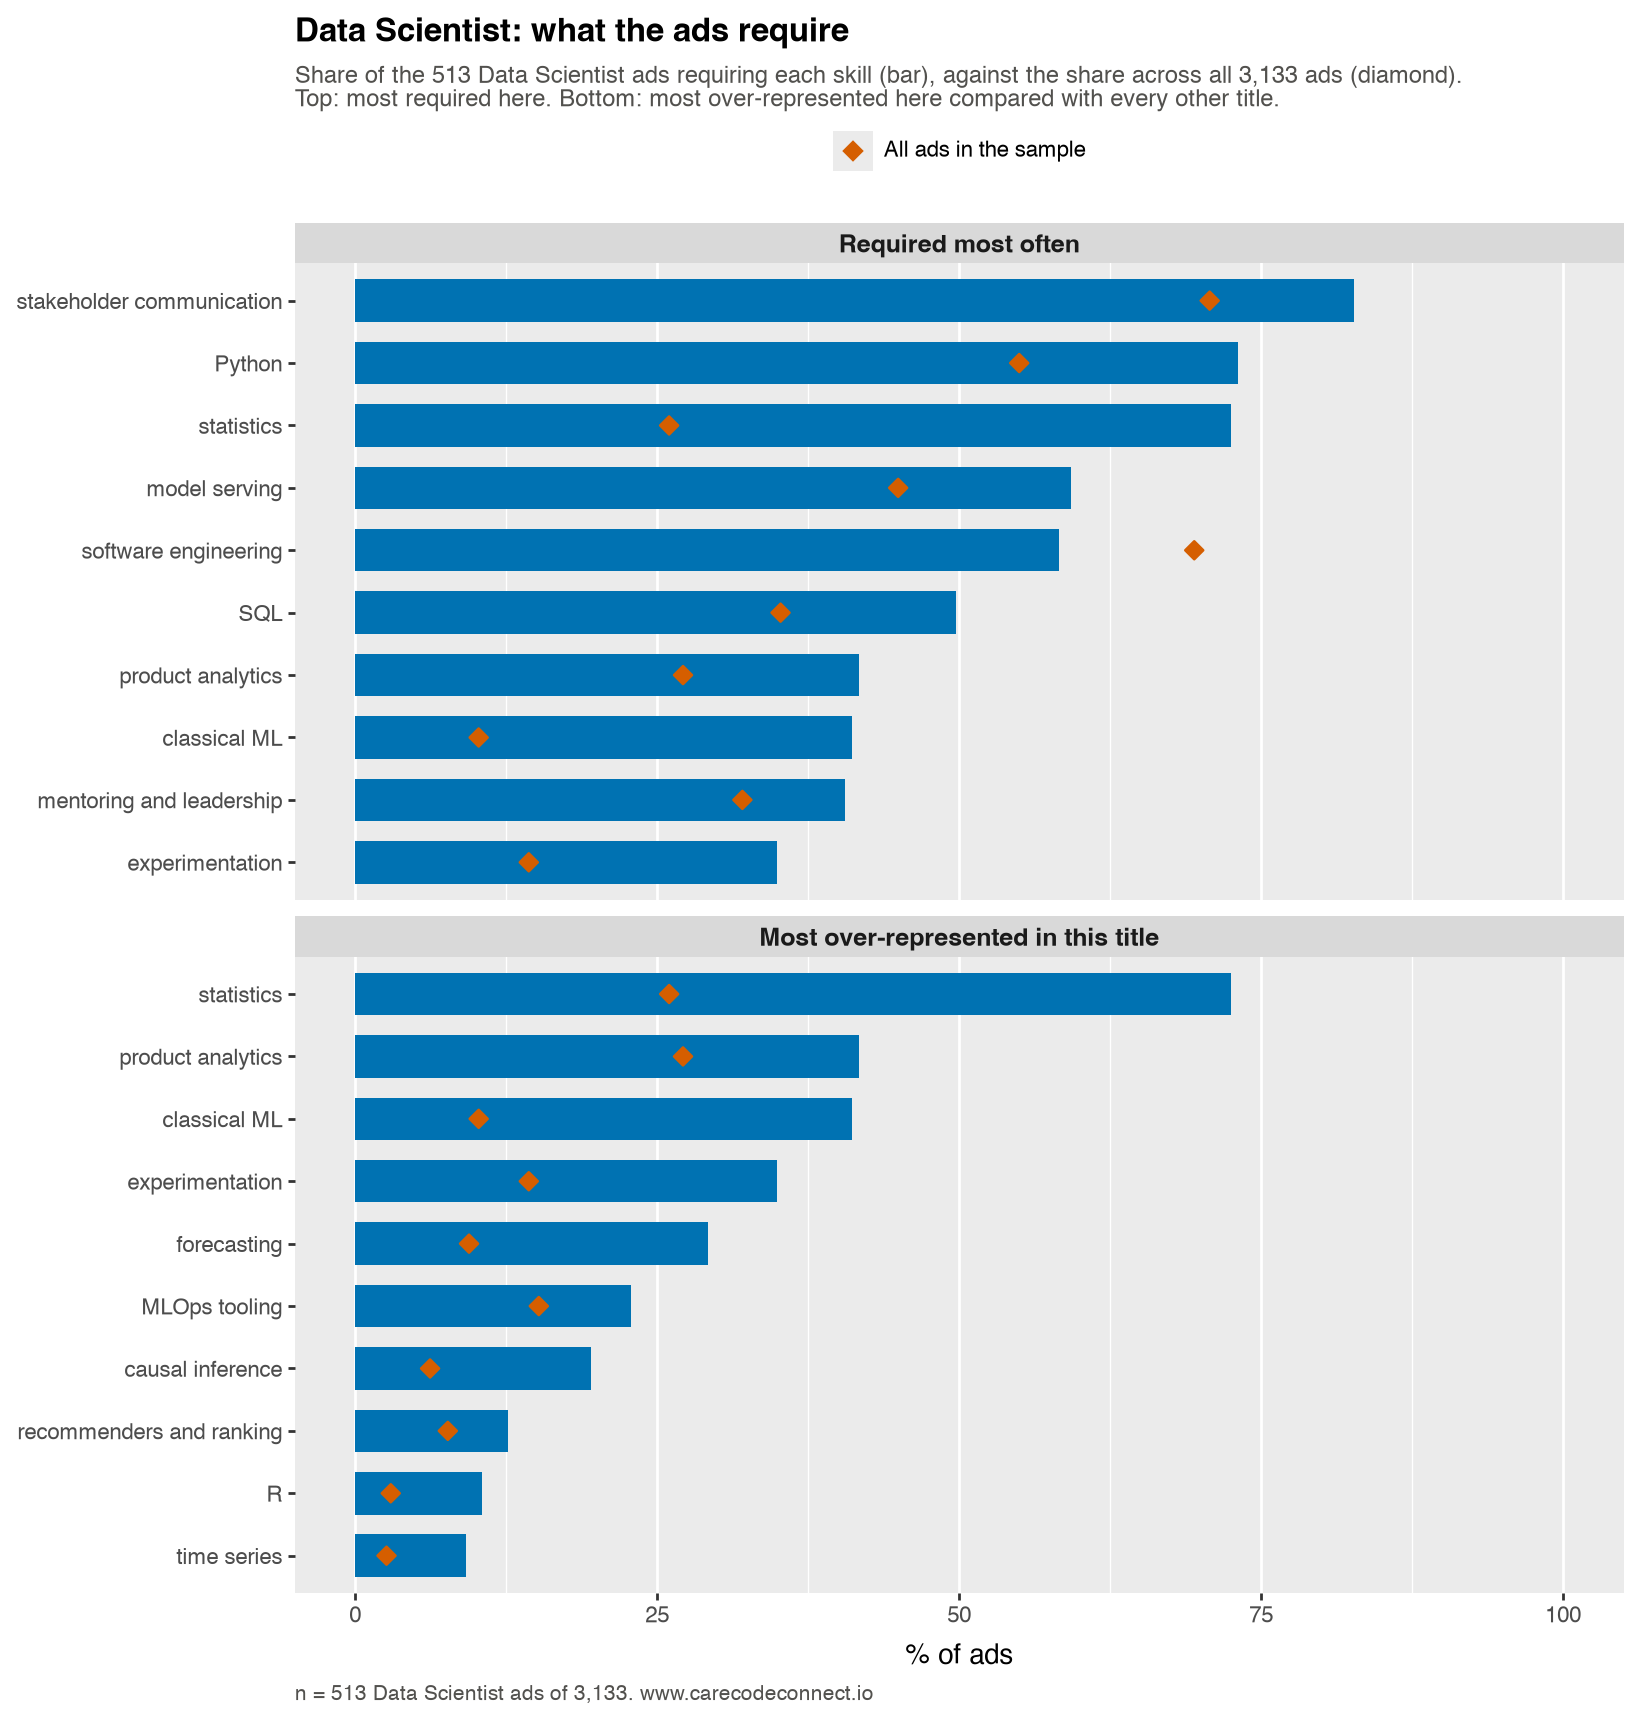
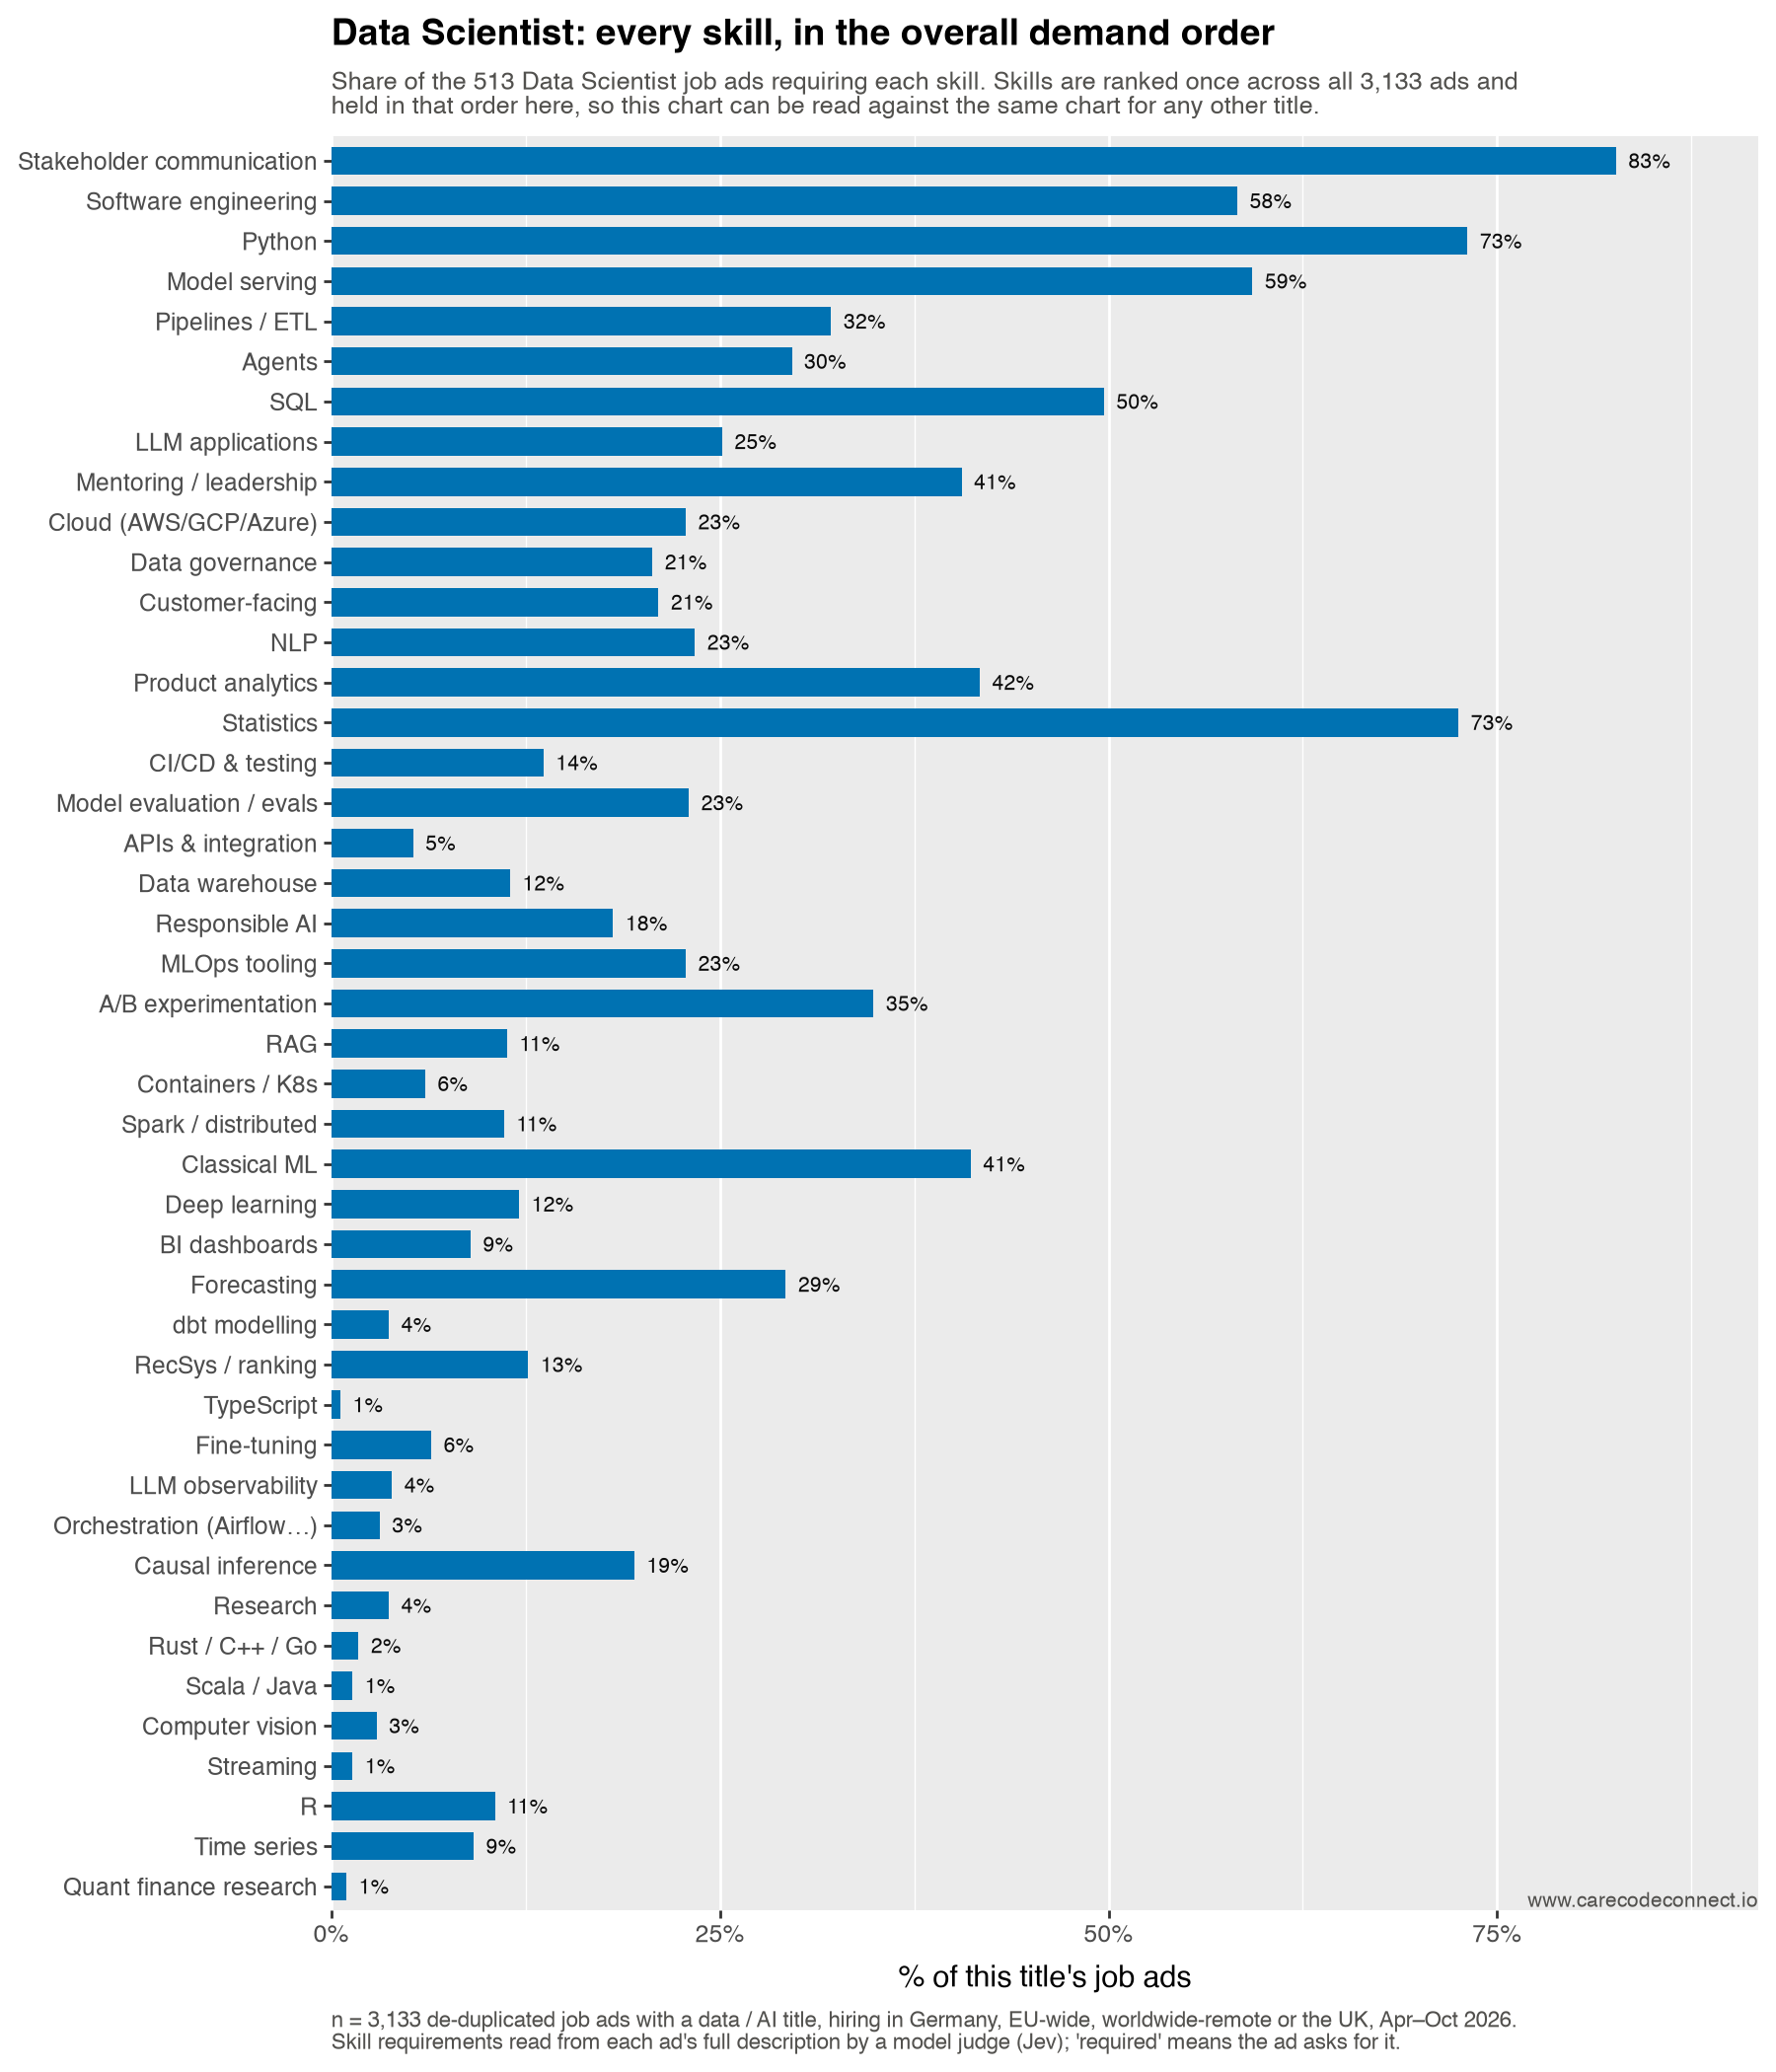
Take-home. 49% of these ads want both a model and its deployment and 16% a model without it; the most distinctive requirement is classical ML, and the nearest title is ML Engineer.
Nearest neighbour. ML Engineer (1.11 apart on the skills map), then Research Scientist (1.18). Furthest: Analytics Engineer (1.85).
Build or call. 55% build or train a model, 35% call one over an API, and 12% want the API work with no model-building at all.
In the ads’ own words. The phrases most over-represented in this title, read out of the ads by a second model that was never shown our skill list, with the share of the title’s ads using each: “regression” (6%), “statistical modeling” (9%), “data science” (29%), “clustering” (6%), “classification” (6%).
experimental design, causal inference and quasi-experimental methods
— one of 69 Data Scientist job ads (13% of the title) that ask for “causal inference”
Expertise in machine learning and predictive modelling
— one of 39 Data Scientist job ads (8% of the title) that ask for “predictive modeling”
Note5. Data Engineer
~2011–2014 · 458 ads, 15% of the sample
Split off from the data scientist once companies discovered that most of the work was moving and shaping data rather than modelling it. Hadoop, then Spark, then the cloud warehouse made the pipeline a full-time job.
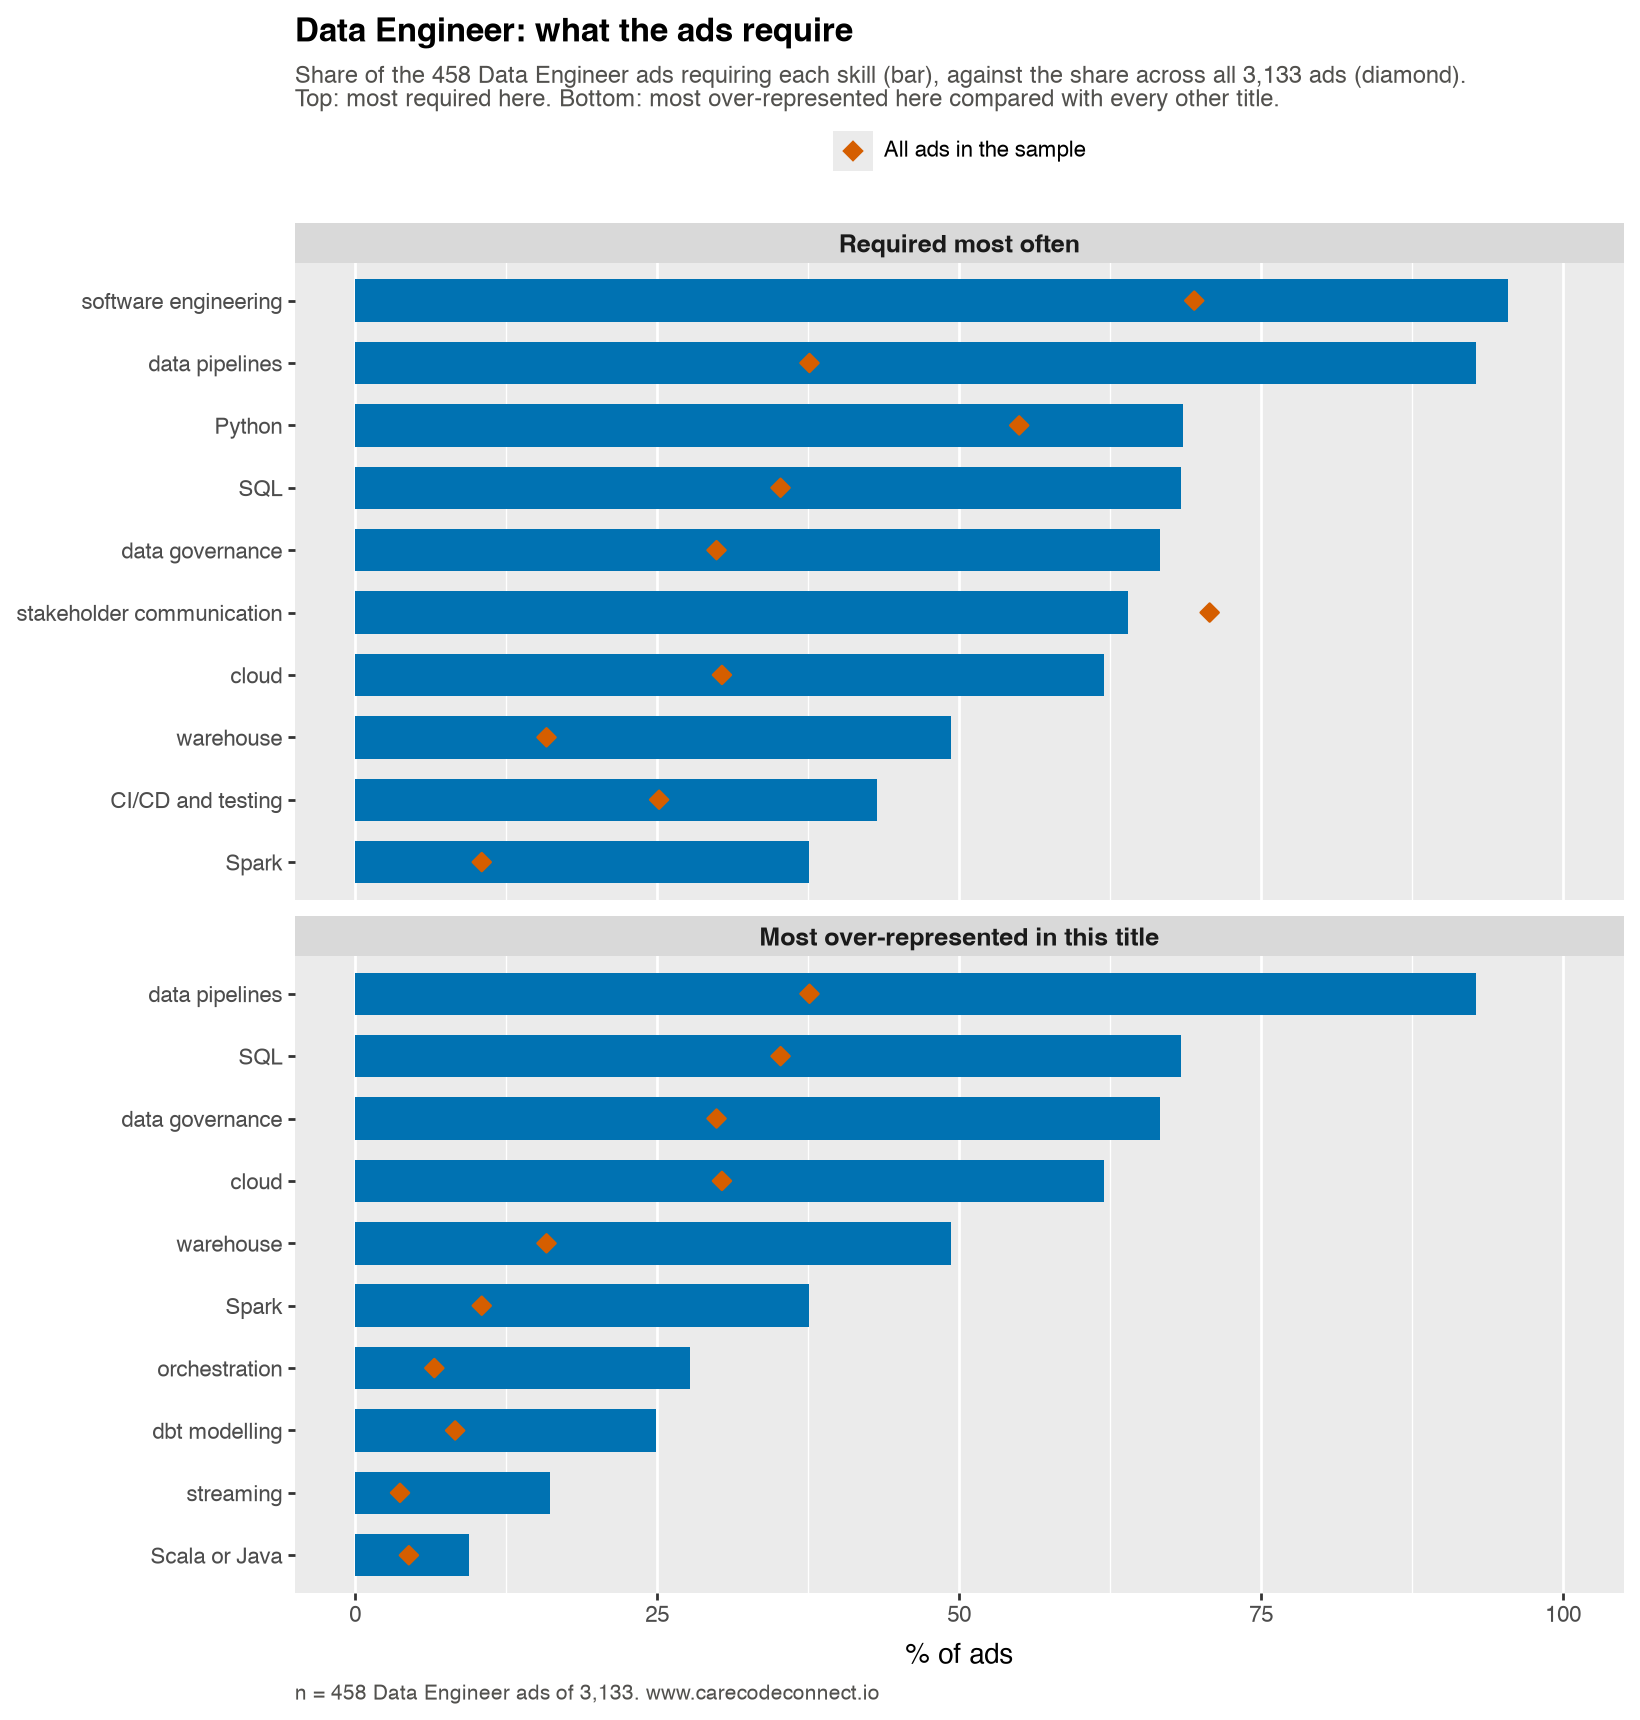
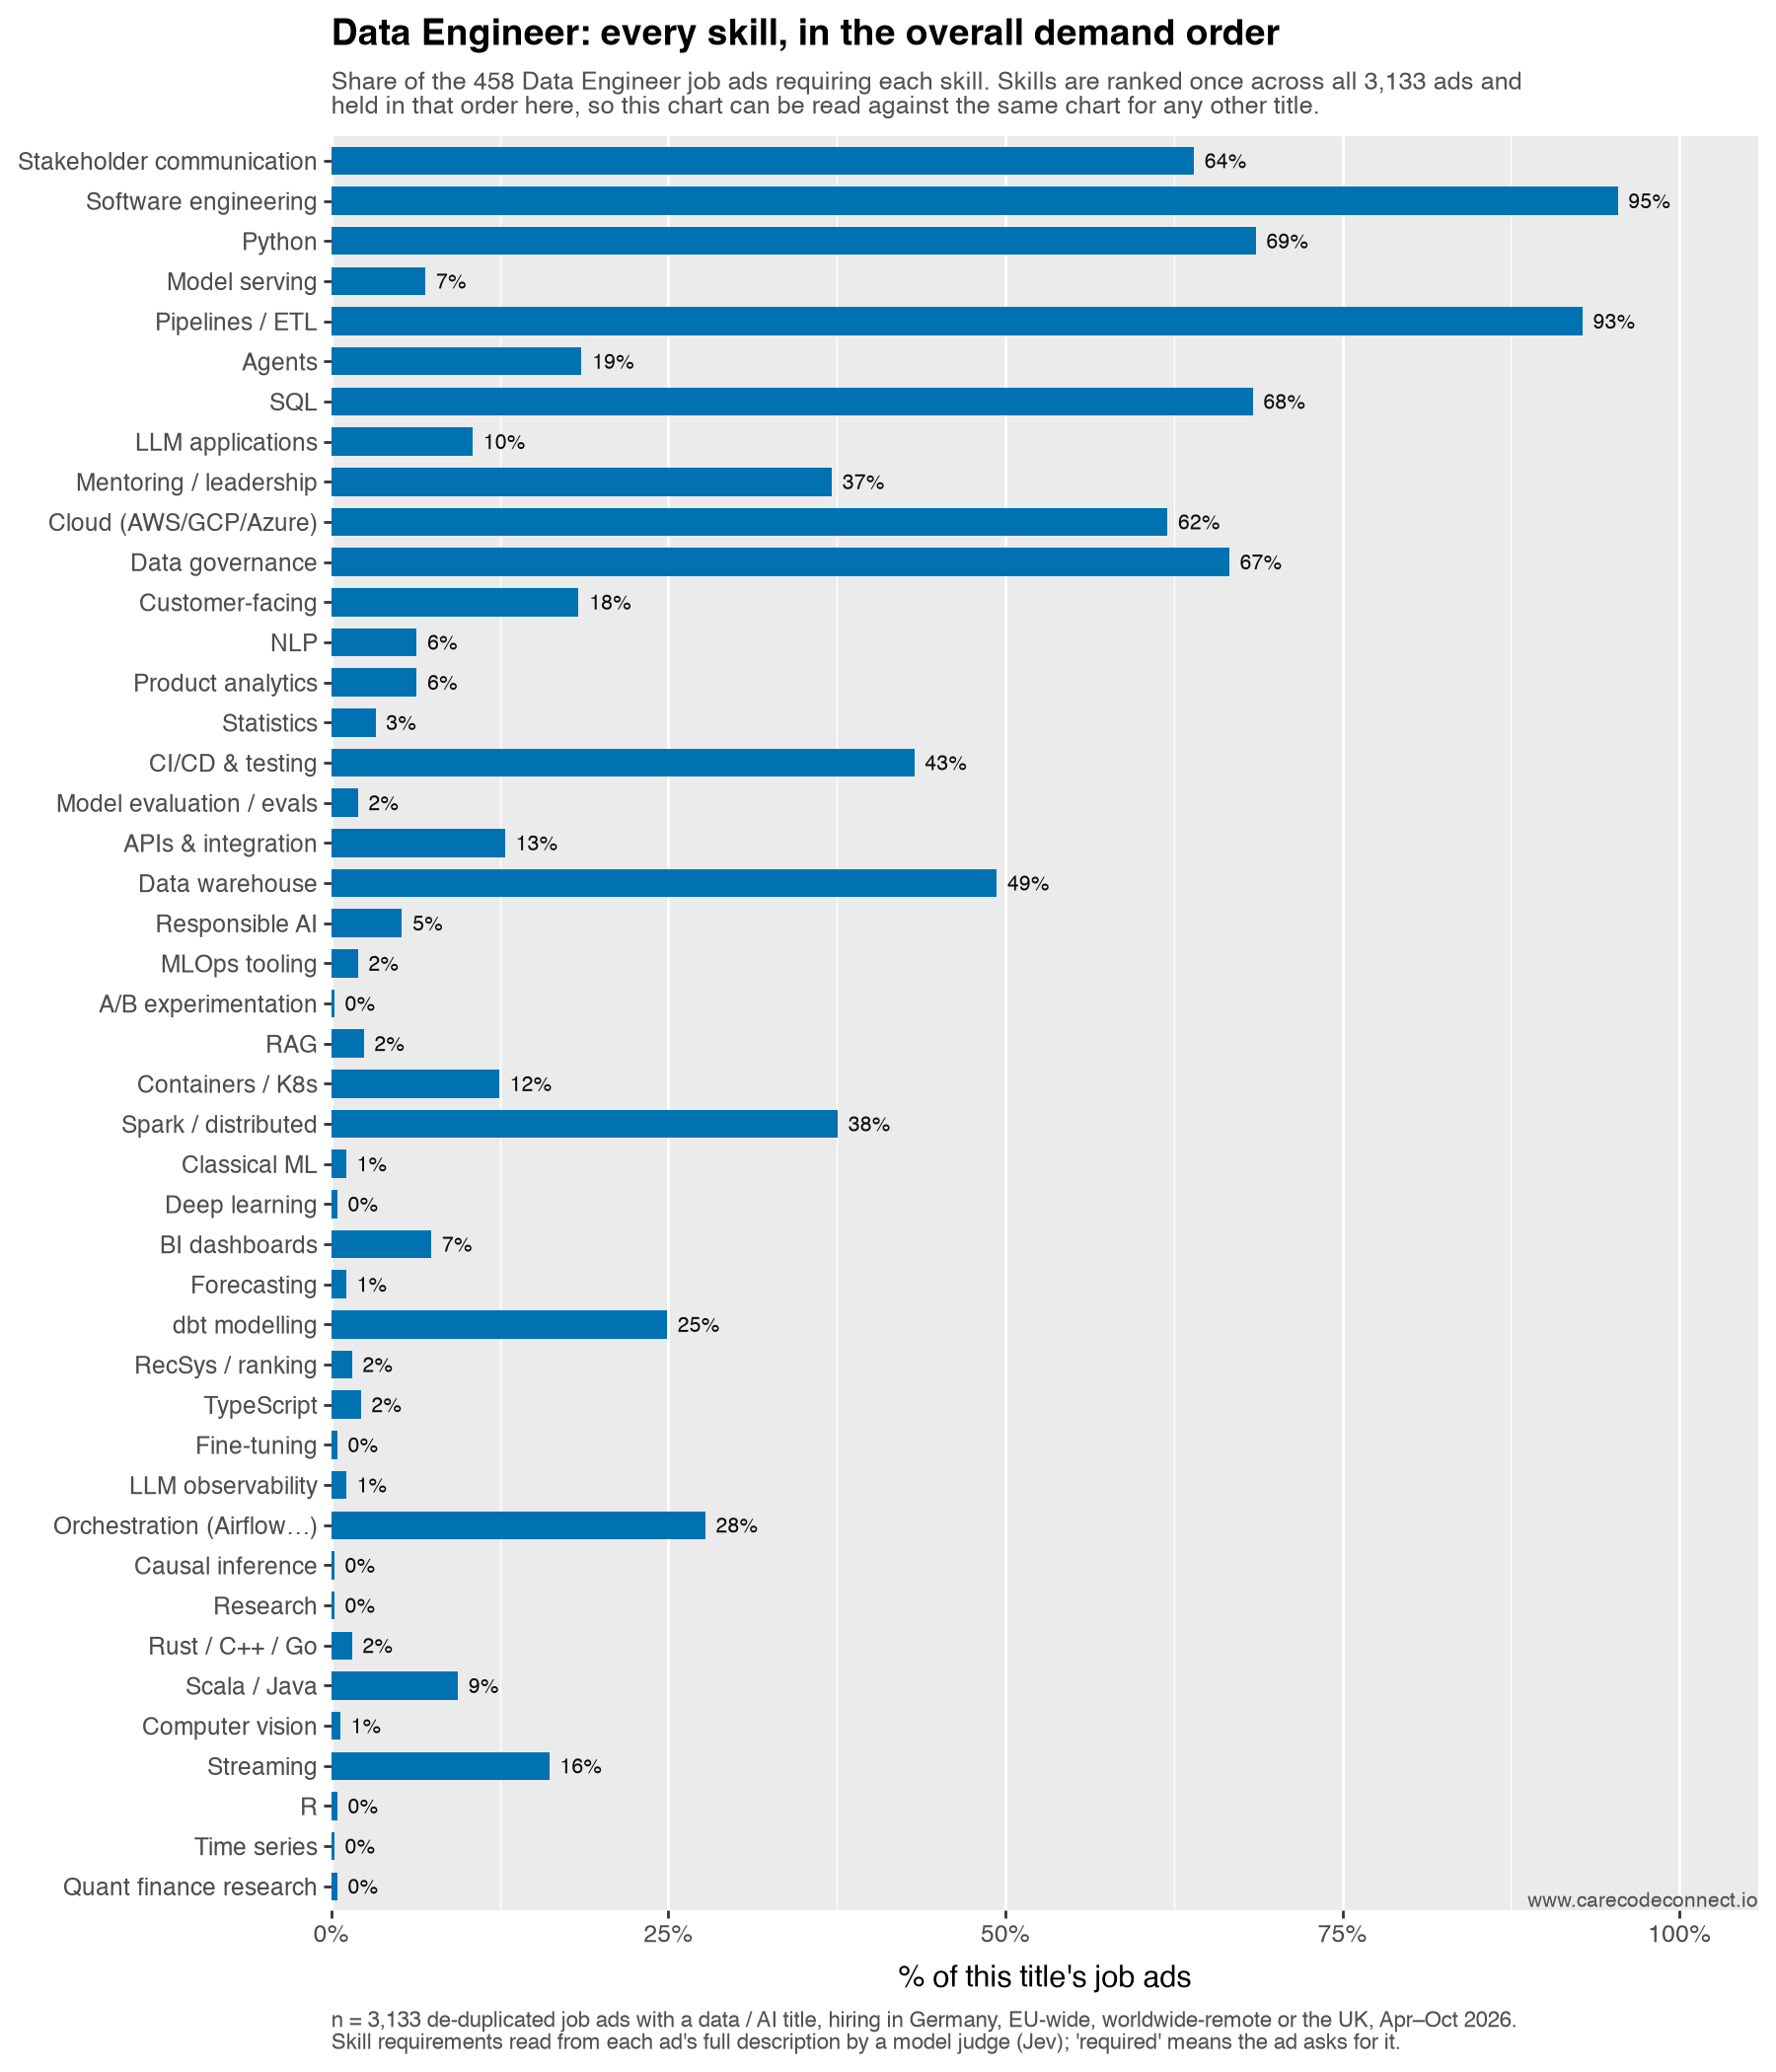
Take-home. 19% of these ads want both a model and its deployment and 3% a model without it; the most distinctive requirement is orchestration, and the nearest title is Analytics Engineer.
Nearest neighbour. Analytics Engineer (0.95 apart on the skills map), then Data Analyst (1.69). Furthest: Quantitative Researcher (2.22).
Build or call. 4% build or train a model, 20% call one over an API, and 19% want the API work with no model-building at all.
In the ads’ own words. The phrases most over-represented in this title, read out of the ads by a second model that was never shown our skill list, with the share of the title’s ads using each: “etl/elt” (10%), “apache airflow” (6%), “delta lake” (6%), “azure data factory” (6%), “data security” (7%).
Own the design of scalable ETL/ELT pipelines
— one of 44 Data Engineer job ads (10% of the title) that ask for “etl/elt”
Note6. ML Engineer
~2015–2016 · 278 ads, 9% of the sample
Split off from the other side of the data scientist: the half concerned with getting a trained model to run reliably for real users. The title tracks the arrival of model serving, feature stores and the tooling that became MLOps.
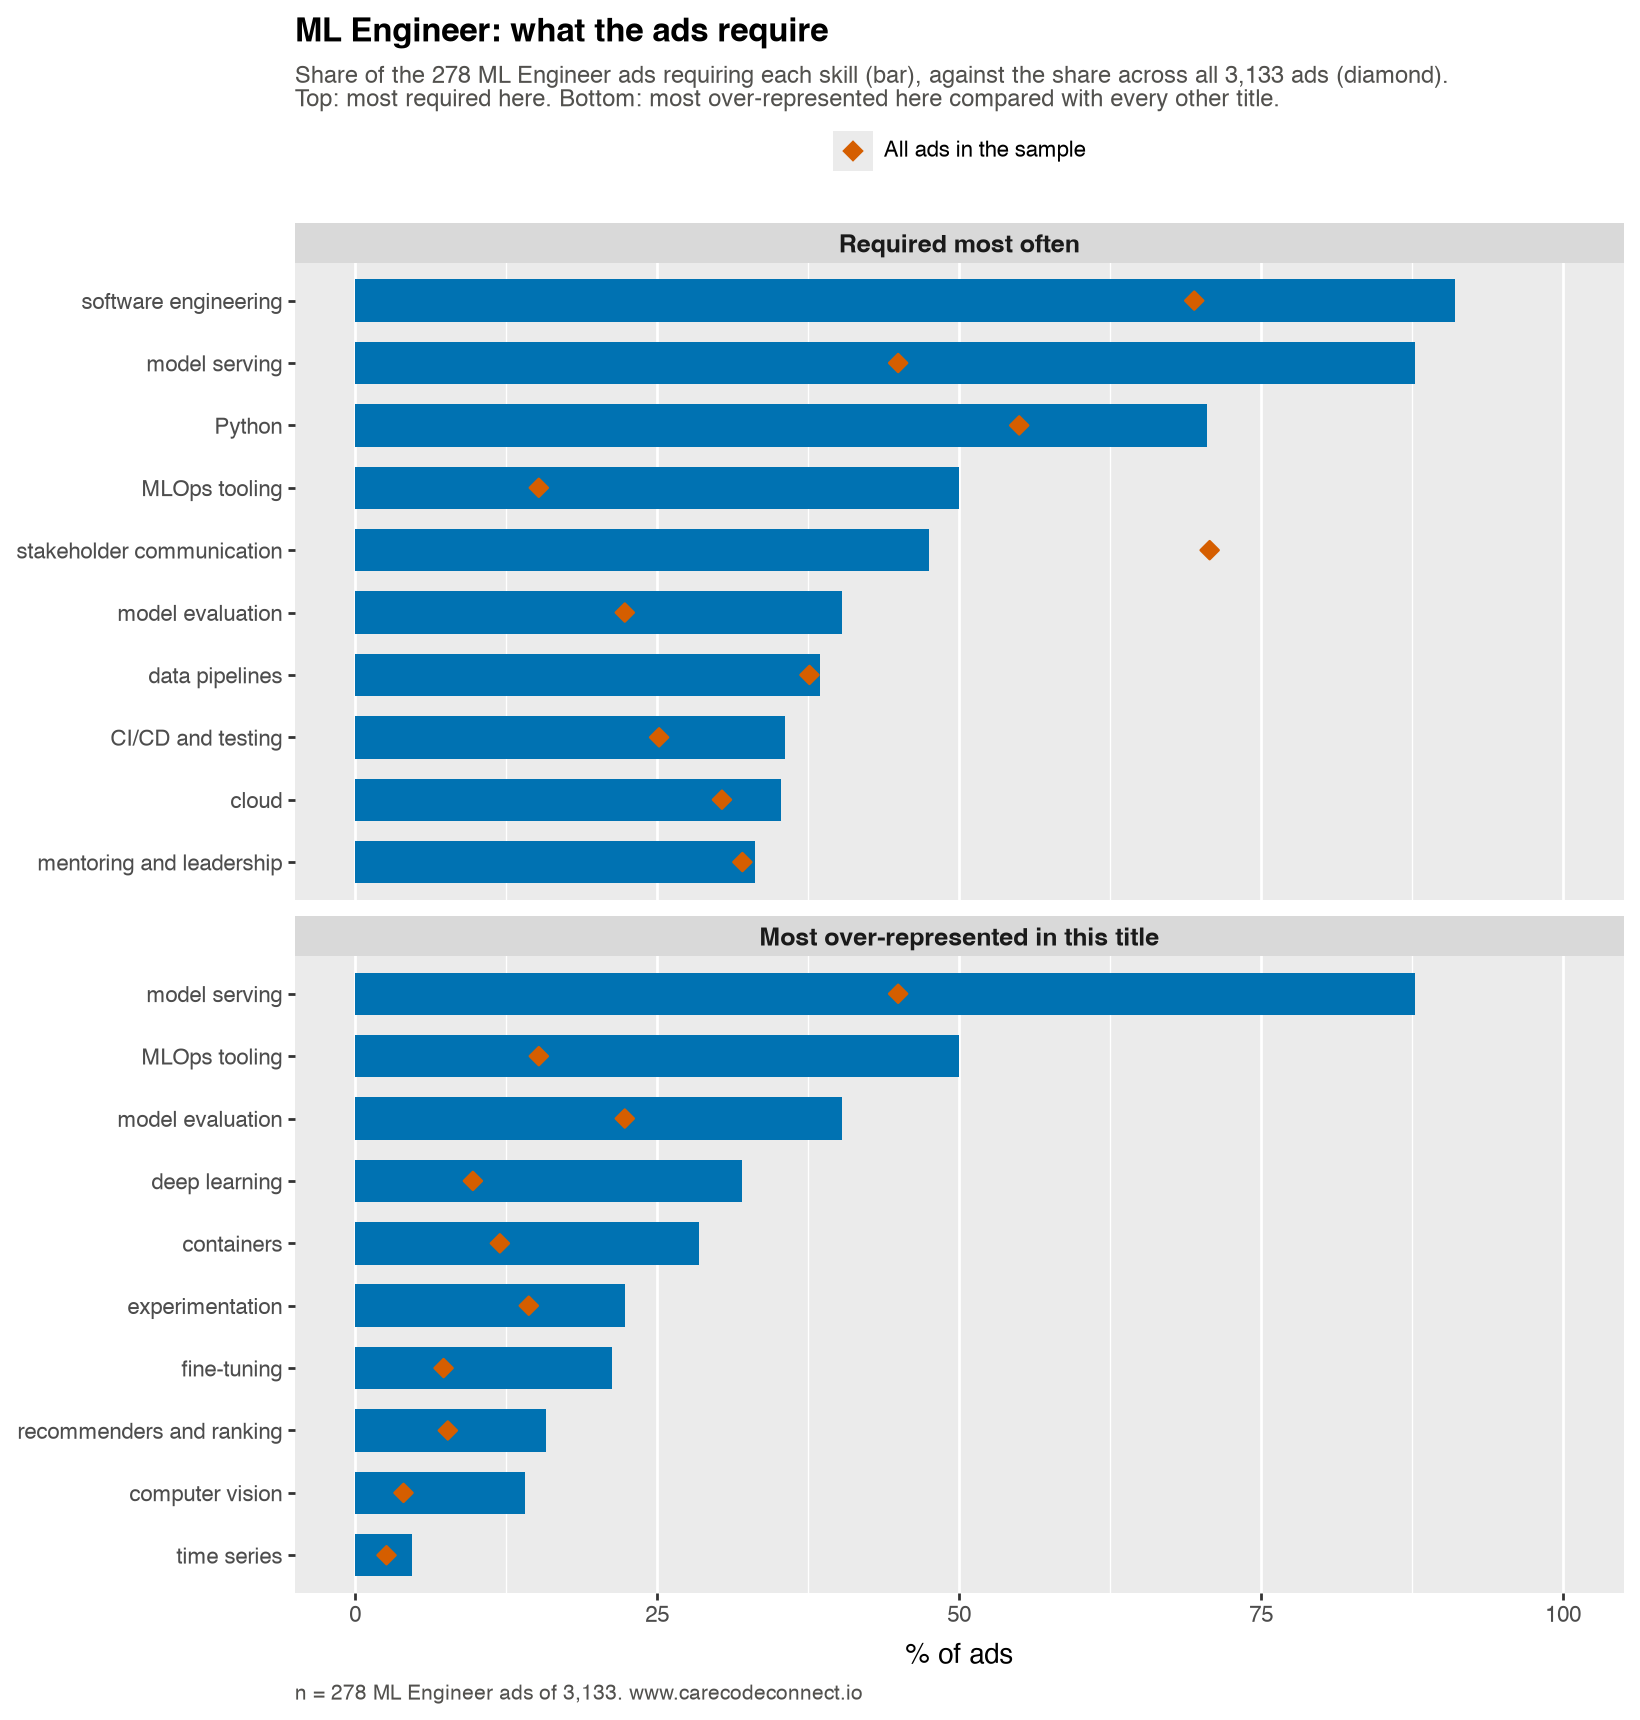
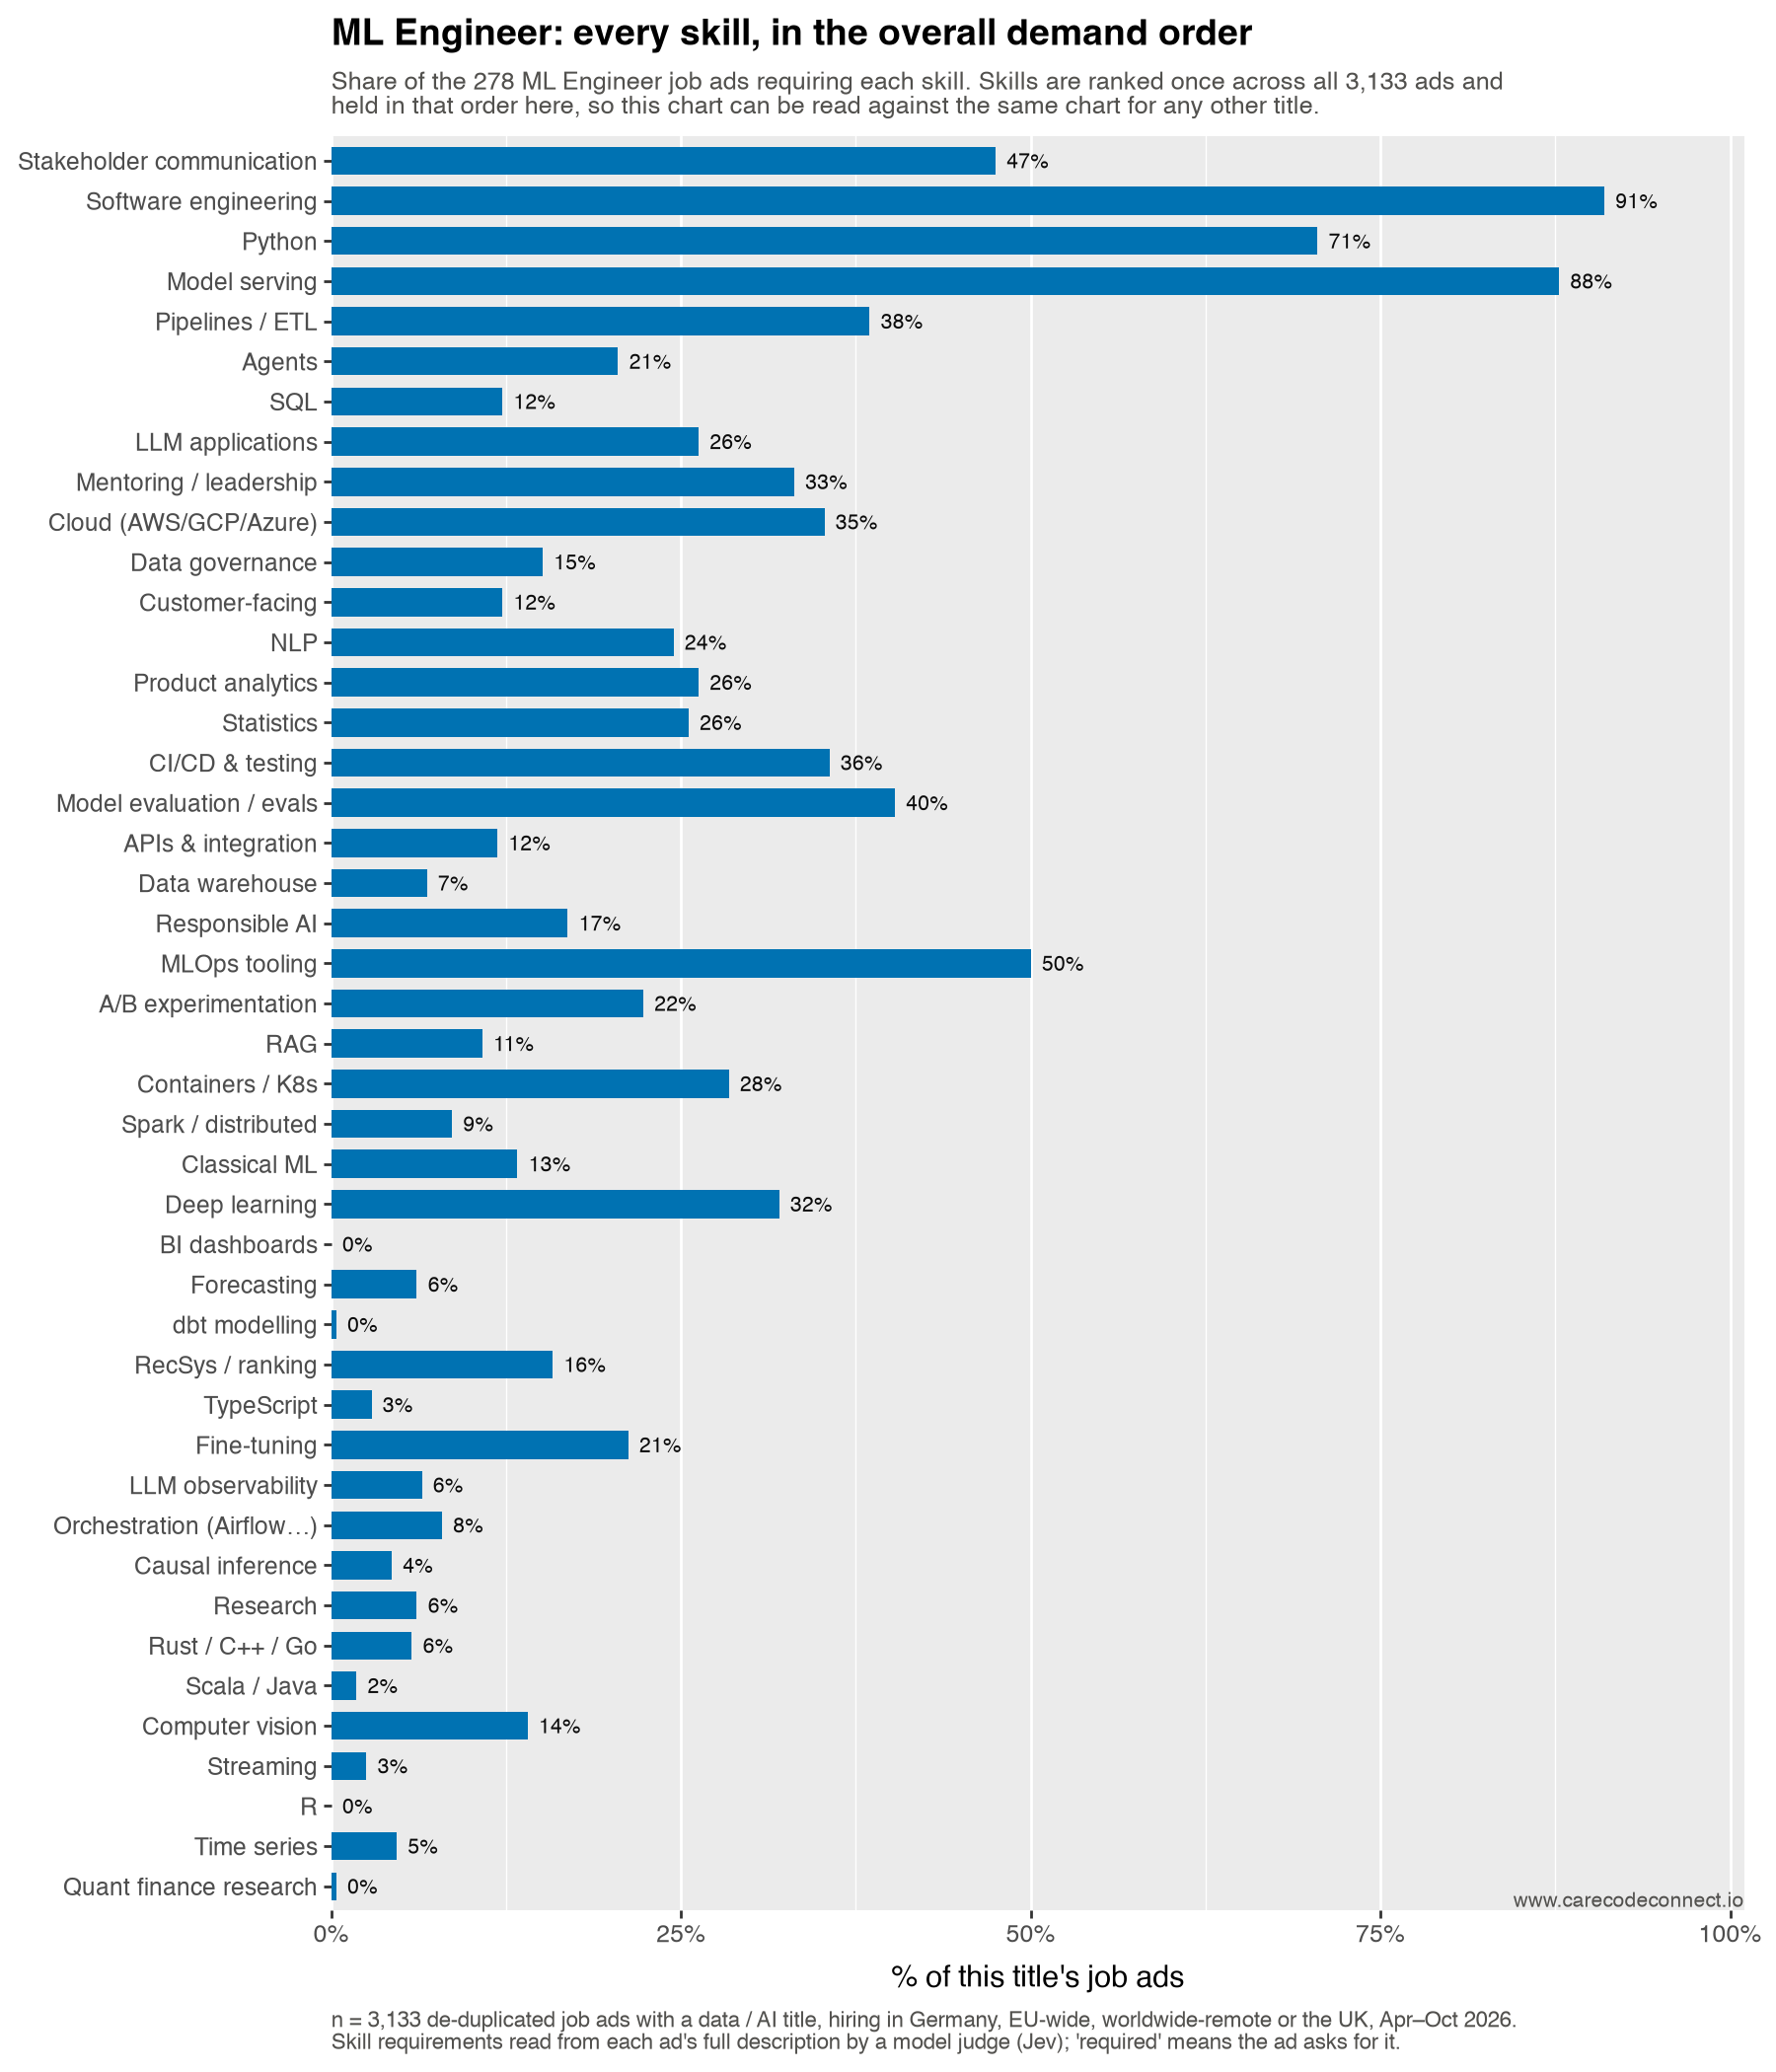
Take-home. 63% of these ads want both a model and its deployment and 5% a model without it; the most distinctive requirement is MLOps tooling, and the nearest title is Research Scientist.
Nearest neighbour. Research Scientist (1.02 apart on the skills map), then AI Engineer (1.06). Furthest: Analytics Engineer (2.02).
Build or call. 63% build or train a model, 35% call one over an API, and 8% want the API work with no model-building at all.
In the ads’ own words. The phrases most over-represented in this title, read out of the ads by a second model that was never shown our skill list, with the share of the title’s ads using each: “ml pipelines” (5%), “model serving” (14%), “kubeflow” (7%), “feature stores” (5%), “diffusion models” (5%).
training and iterating on deep learning models
— one of 25 ML Engineer job ads (9% of the title) that ask for “model training”
transition of machine learning models into production
— one of 49 ML Engineer job ads (18% of the title) that ask for “model deployment”
Note7. Analytics Engineer
~2018–2019 · 102 ads, 3% of the sample
The newest of the analytics titles, and essentially a dbt-era invention: apply software engineering practice — version control, tests, modular transformations — to the modelling layer between the warehouse and the dashboard.
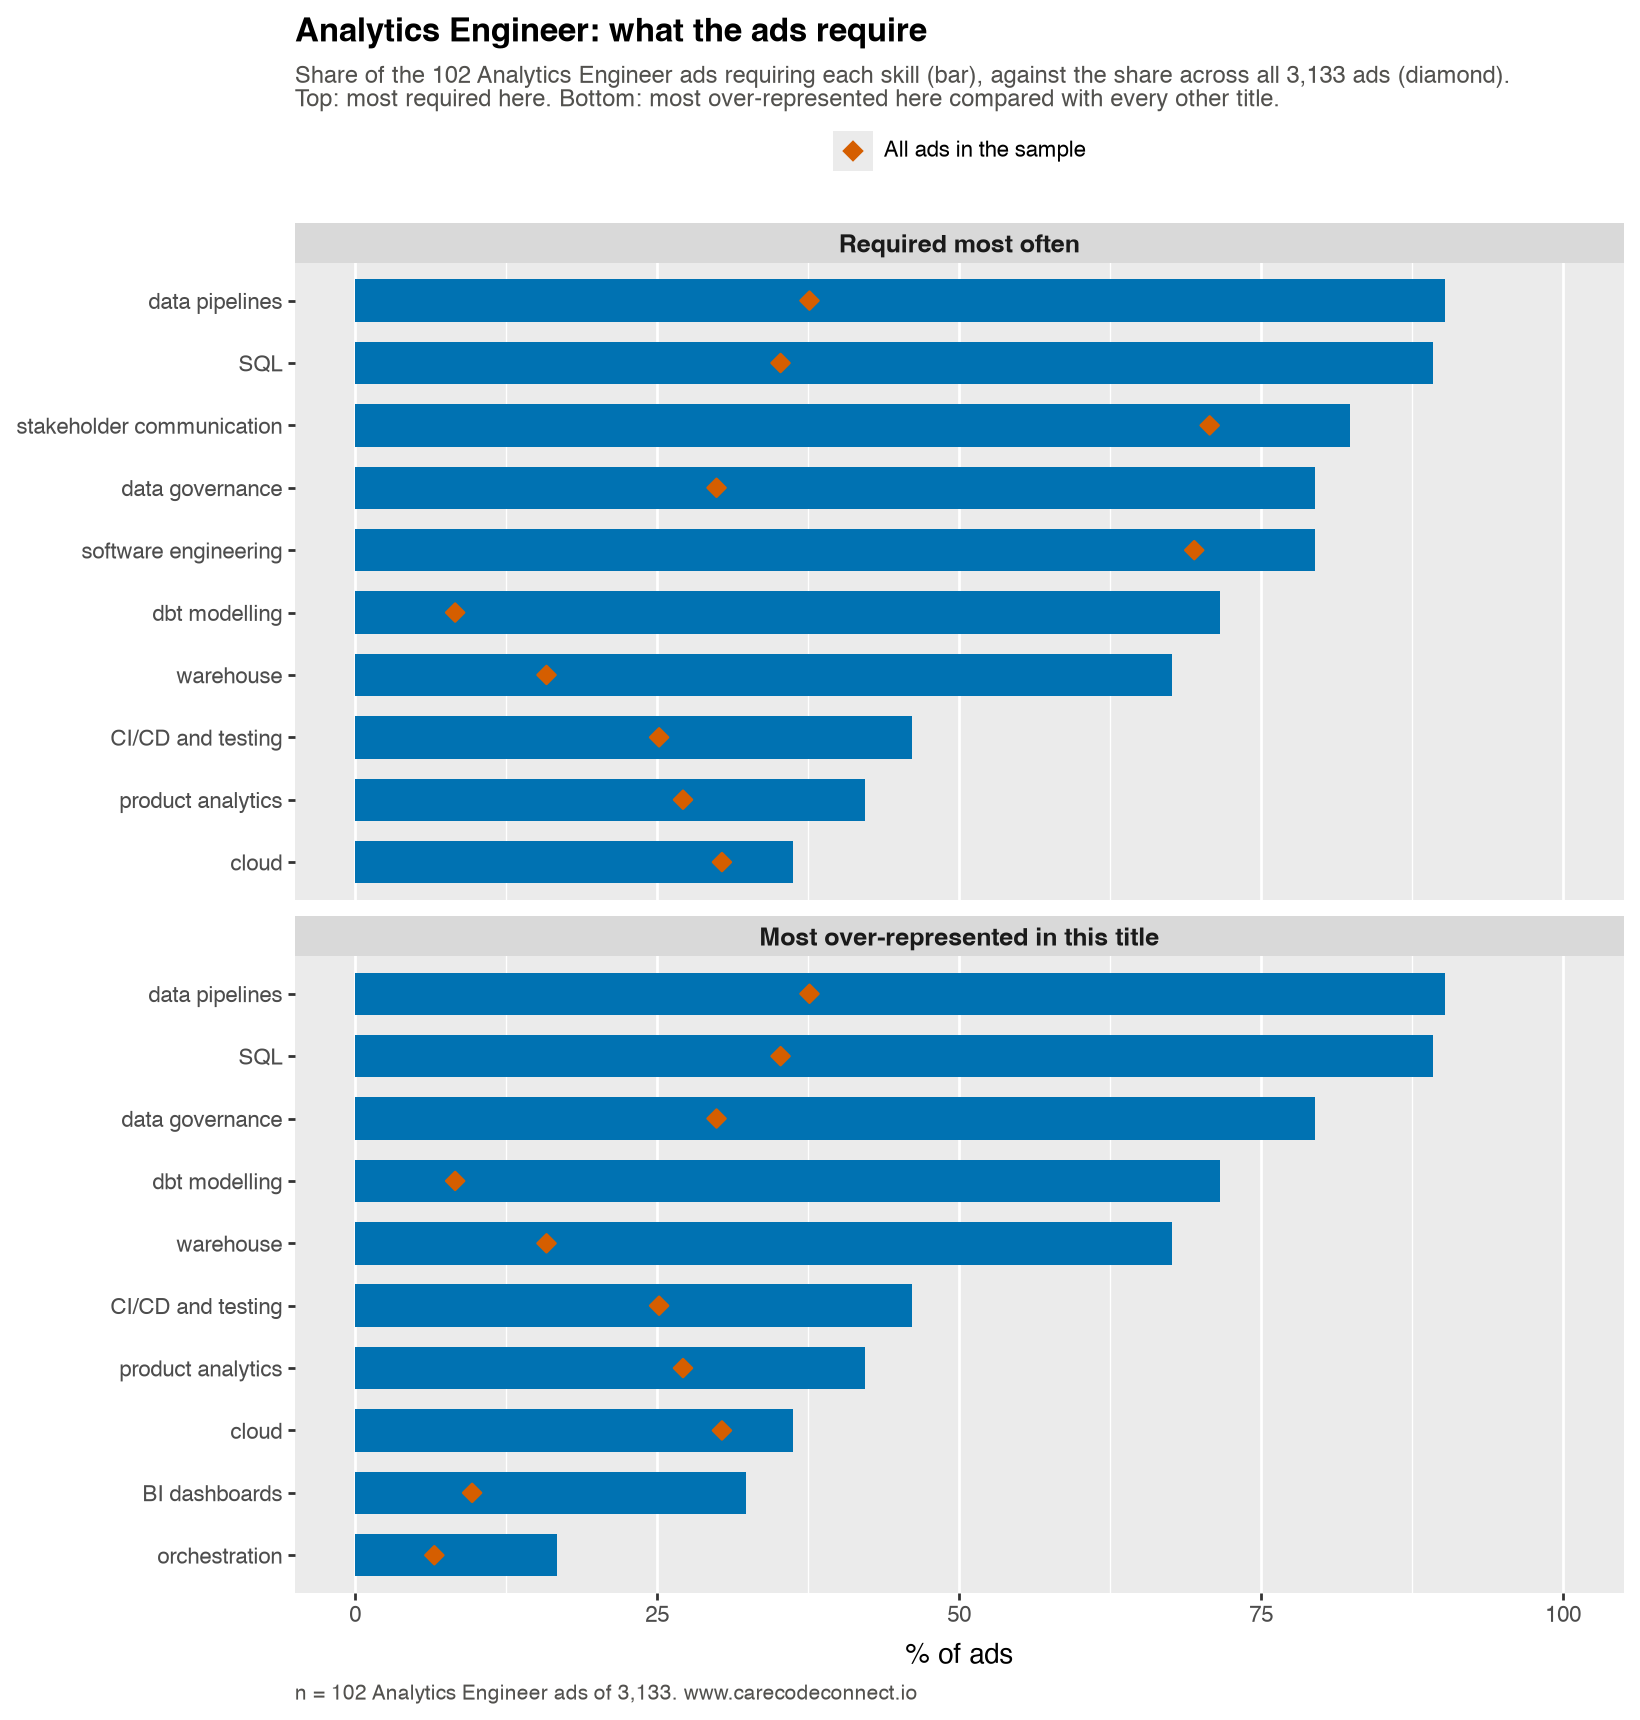
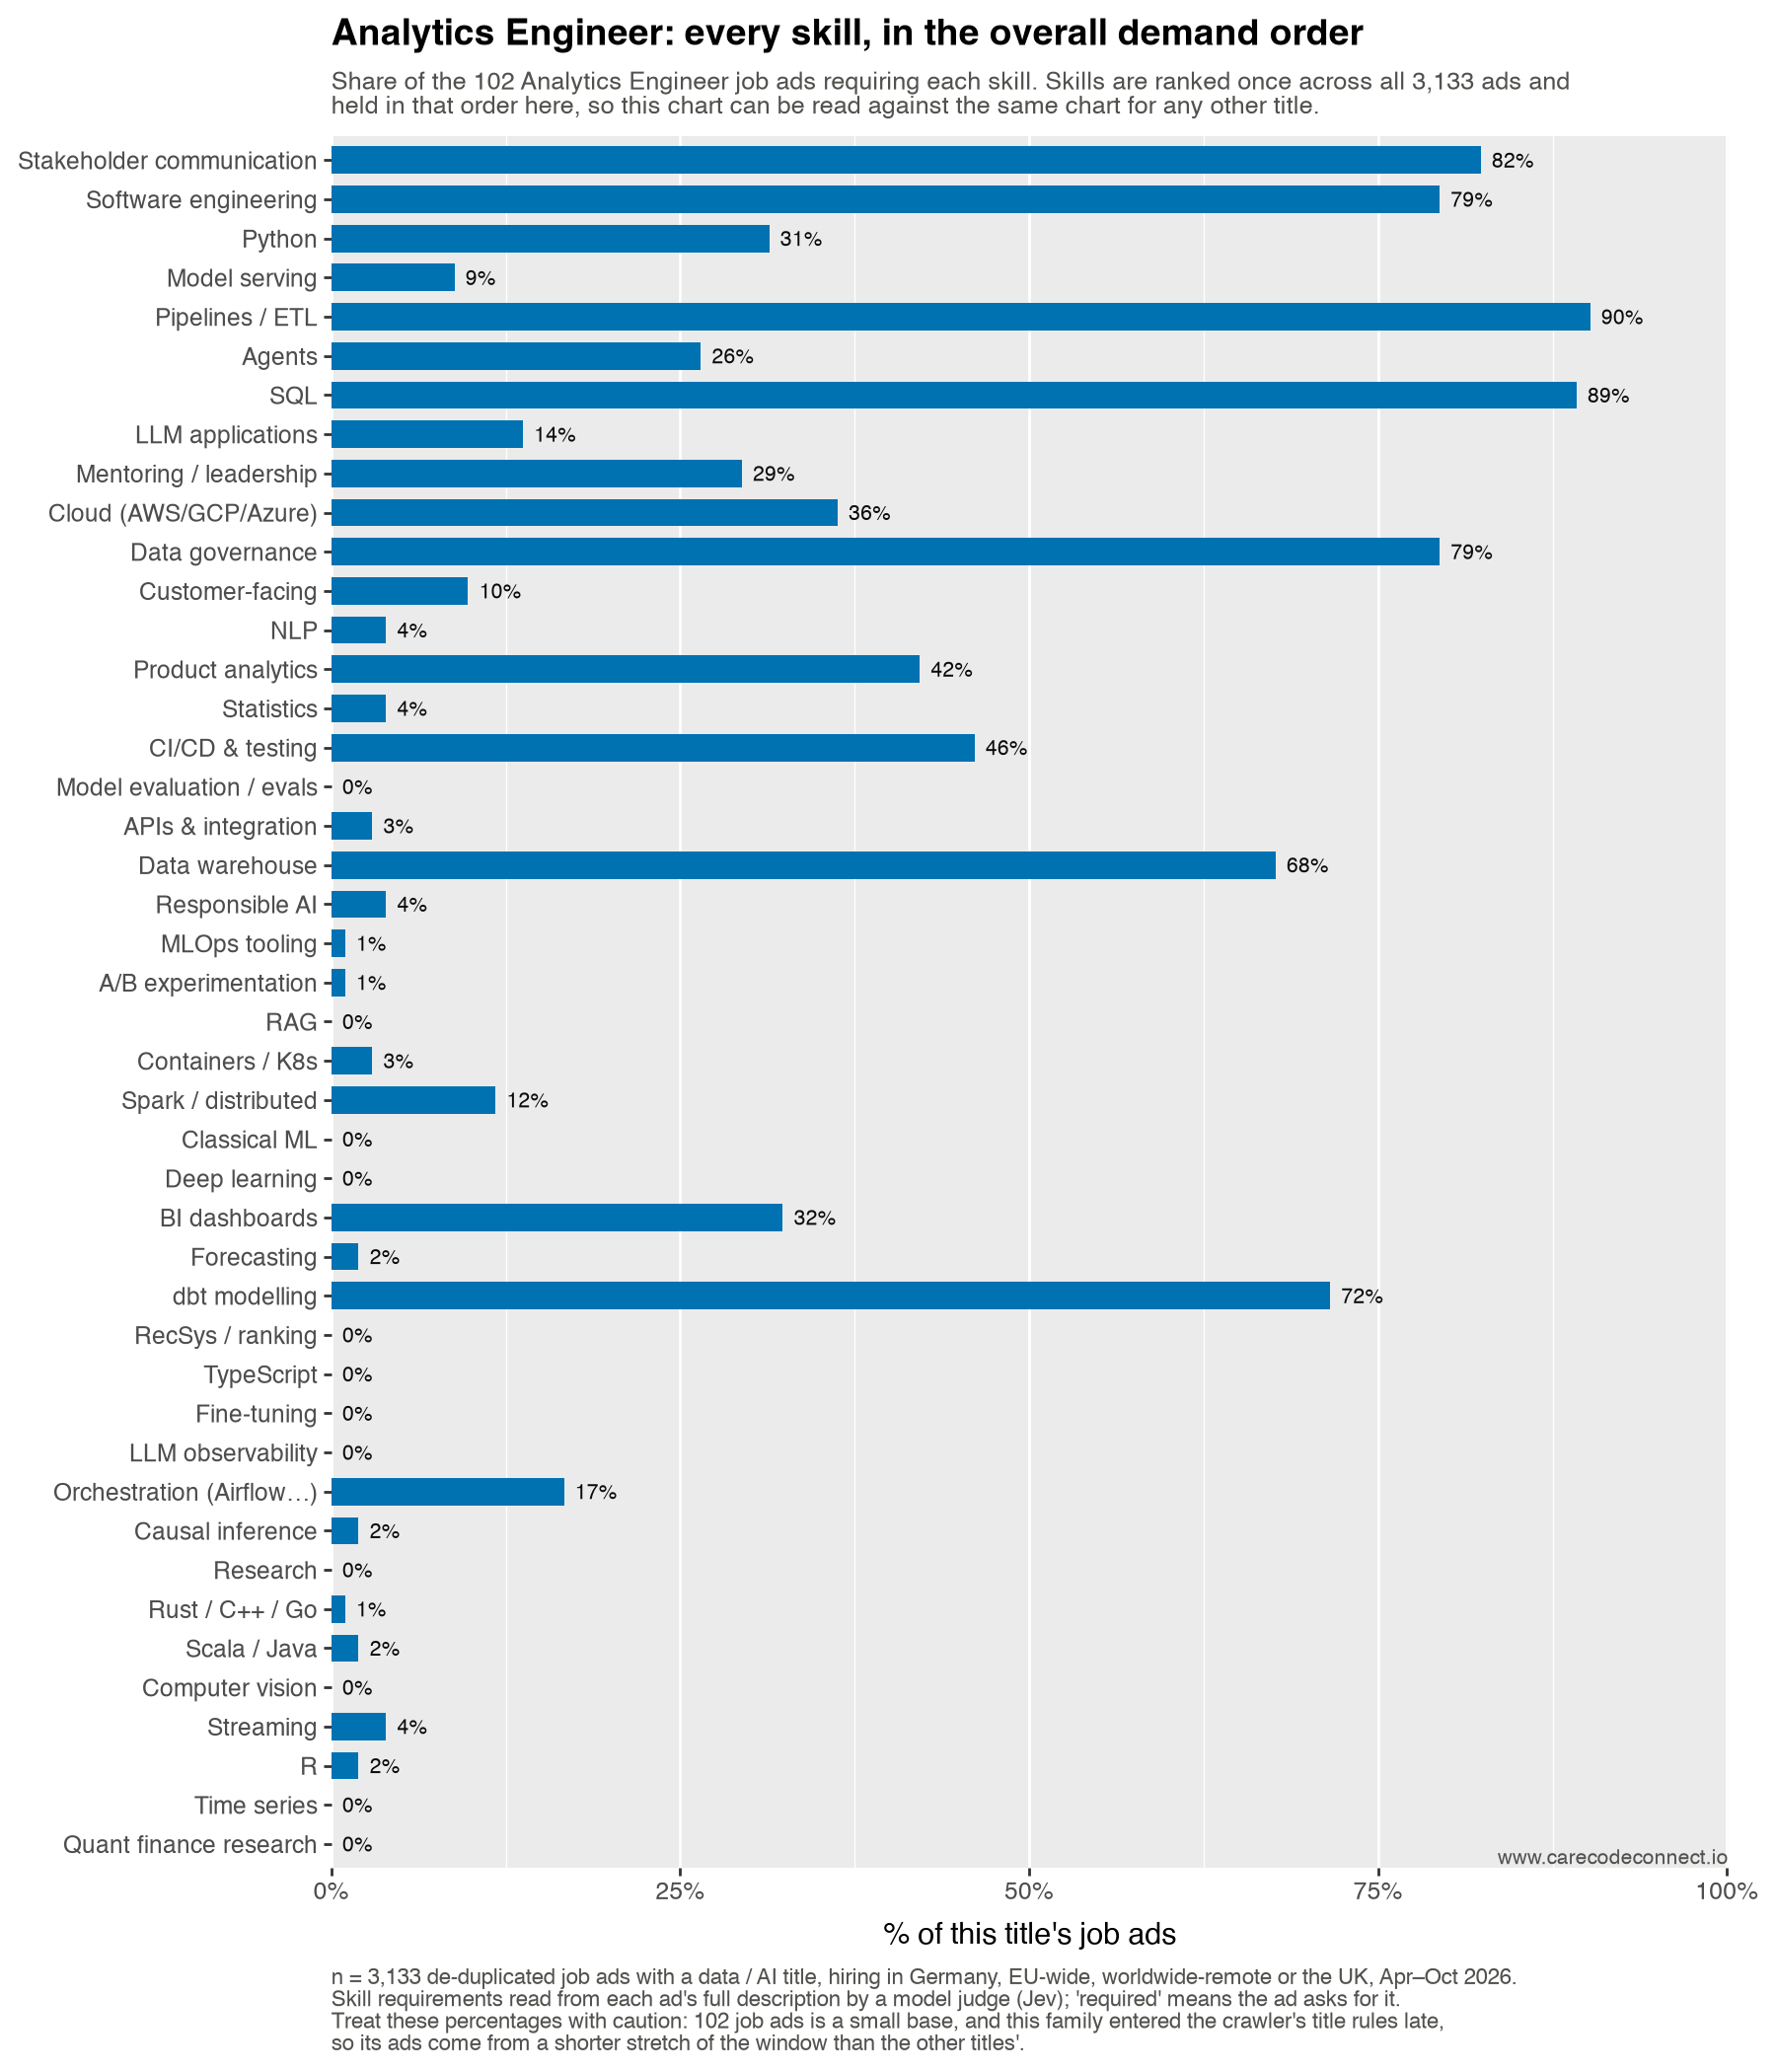
Read these percentages with caution. 102 job ads is a small base: a single ad moves any figure here by about 1 point. It is a rare title in this pool rather than a late-admitted one, so the base is small but the window is the same as every other title’s.
Take-home. 21% of these ads want both a model and its deployment and 6% a model without it; the most distinctive requirement is dbt modelling, and the nearest title is Data Engineer.
Nearest neighbour. Data Engineer (0.95 apart on the skills map), then Data Analyst (1.47). Furthest: Quantitative Researcher (2.39).
Build or call. 0% build or train a model, 26% call one over an API, and 26% want the API work with no model-building at all.
In the ads’ own words. The phrases most over-represented in this title, read out of the ads by a second model that was never shown our skill list, with the share of the title’s ads using each: “semantic layer” (6%), “analytics engineering” (20%), “dimensional modeling” (13%), “data quality testing” (6%), “semantic layers” (6%).
modeled in dbt and orchestrated by Airflow
— one of 61 Analytics Engineer job ads (60% of the title) that ask for “dbt”
Note8. Forward Deployed
Palantir-era term, mainstream from ~2023 · 468 ads, 15% of the sample
A solutions-engineering lineage with a newer name. The engineer is embedded with the customer, building and adapting the product in front of them. The term escaped Palantir and spread as AI vendors discovered their product needed fitting to each buyer.
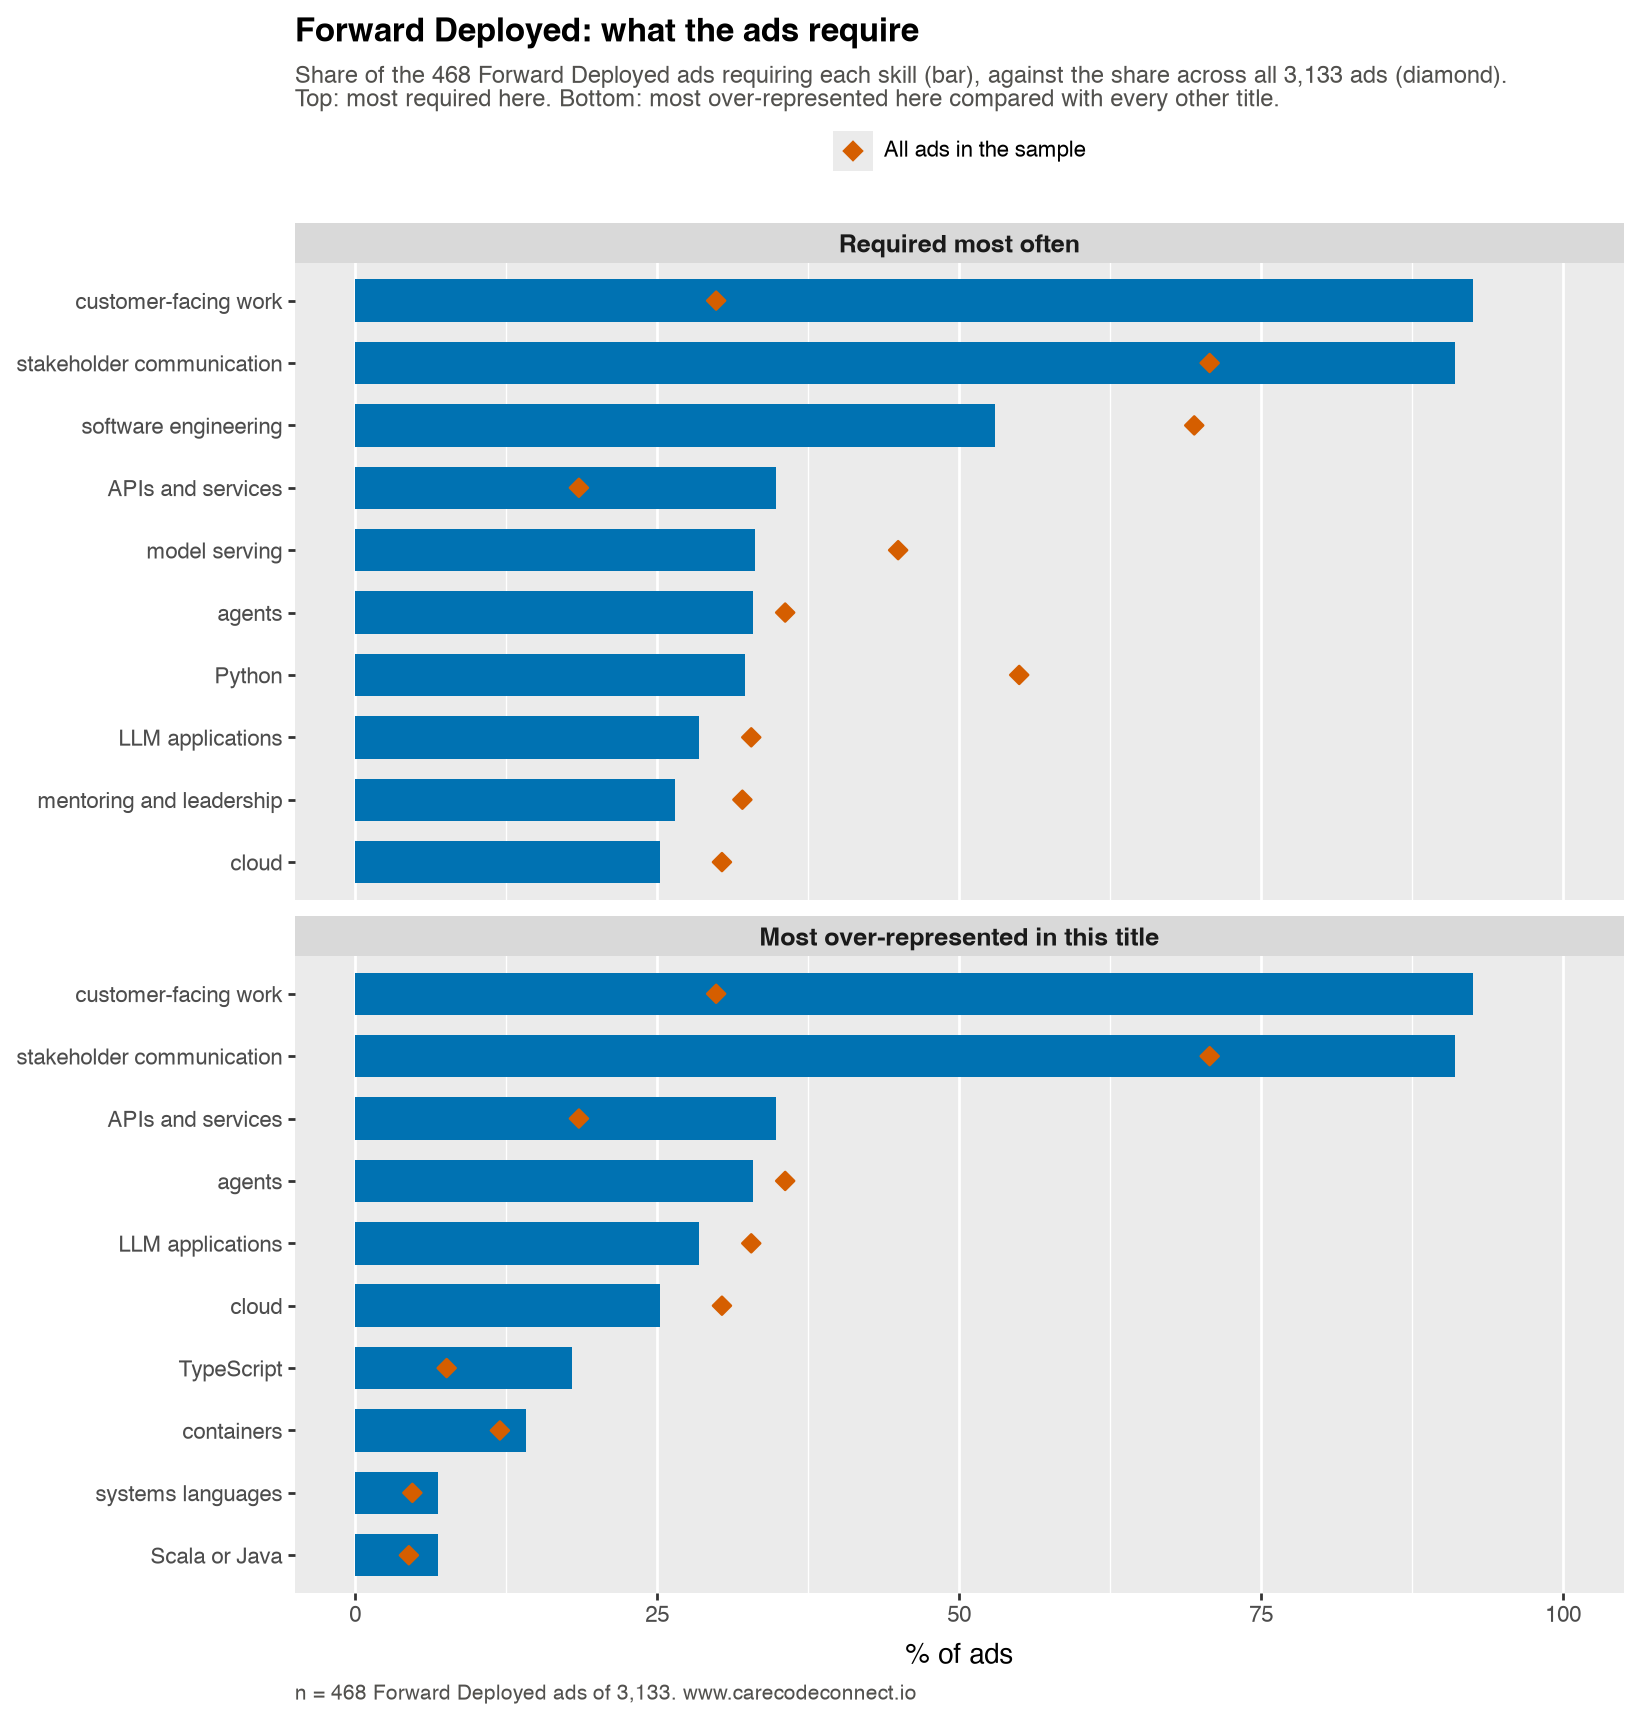
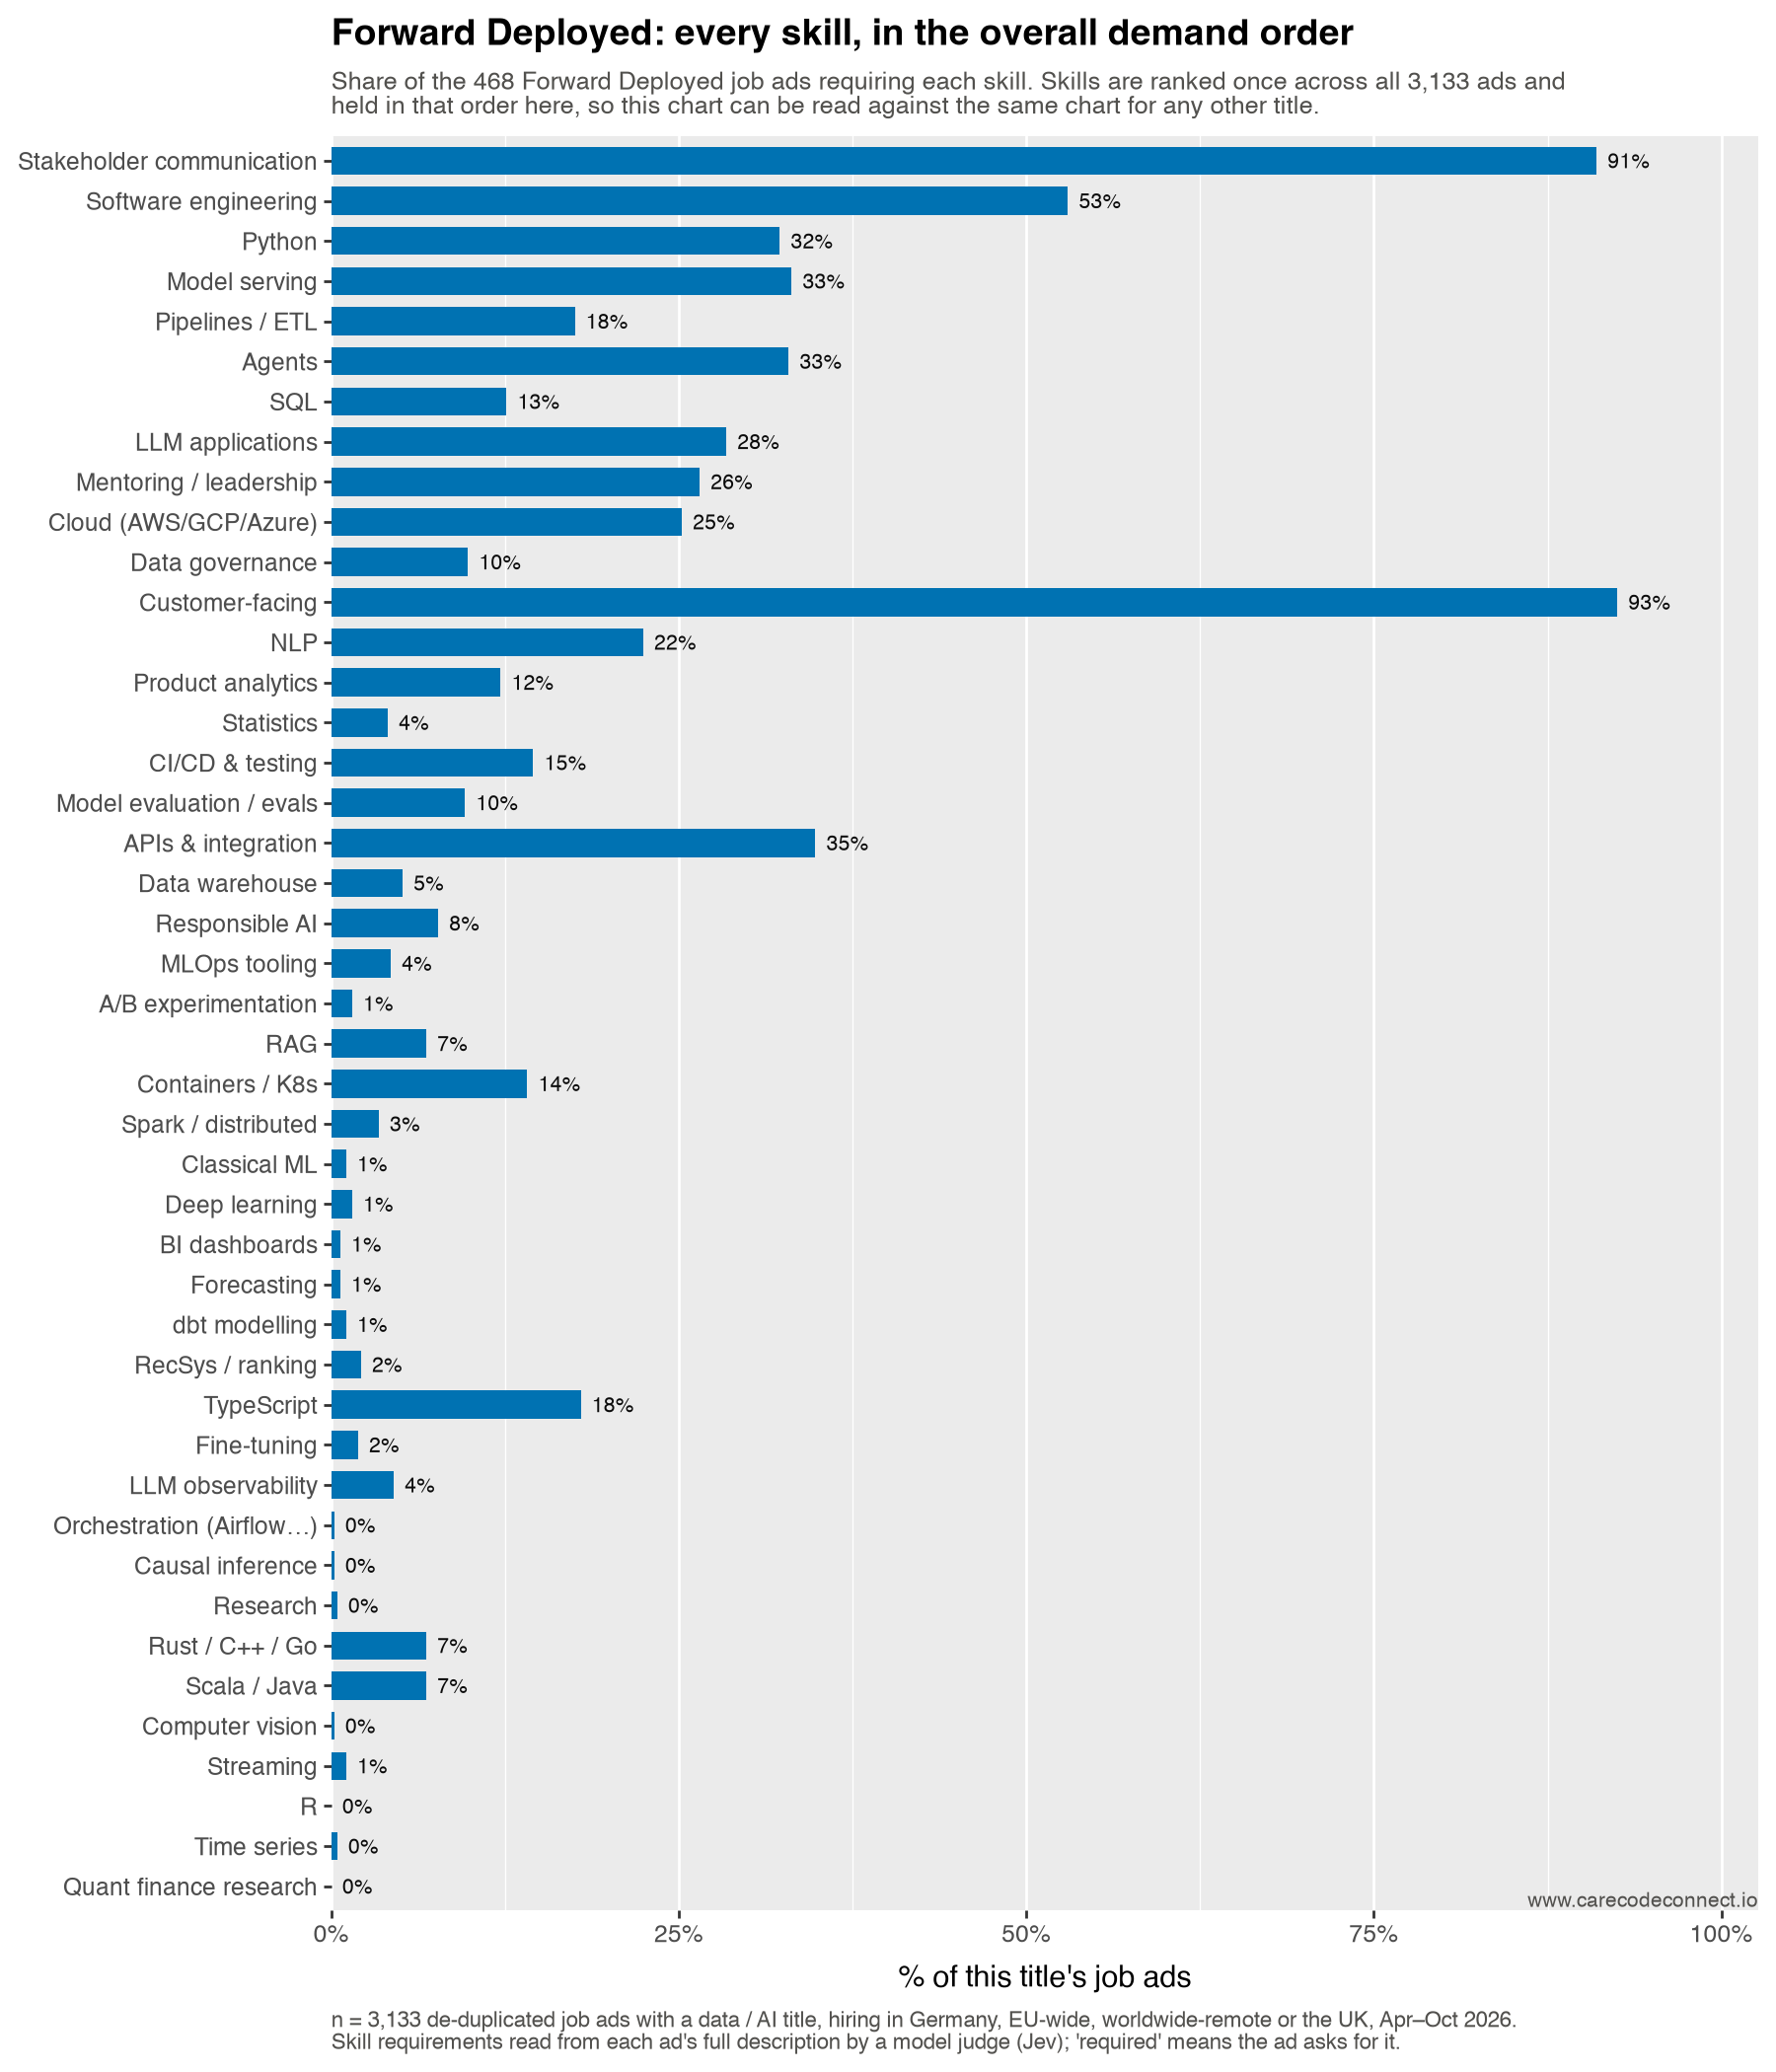
Take-home. 29% of these ads want both a model and its deployment and 7% a model without it; the most distinctive requirement is customer-facing work, and the nearest title is AI Automation.
Nearest neighbour. AI Automation (1.22 apart on the skills map), then Research Scientist (1.34). Furthest: Analytics Engineer (1.97).
Build or call. 6% build or train a model, 35% call one over an API, and 31% want the API work with no model-building at all.
In the ads’ own words. The phrases most over-represented in this title, read out of the ads by a second model that was never shown our skill list, with the share of the title’s ads using each: “solutions engineering” (12%), “solution architecture” (9%), “customer communication” (7%), “solution design” (5%), “customer engagement” (5%).
8+ years experience in Solution Engineering role
— one of 57 Forward Deployed job ads (12% of the title) that ask for “solutions engineering”
Note9. AI Engineer
~2023 · 730 ads, 23% of the sample
The newest title in the sample and already the largest. It arrived with the production LLM stack — applications, retrieval, agents, evaluation — and it is the one title here defined by what it builds with rather than what it knows.
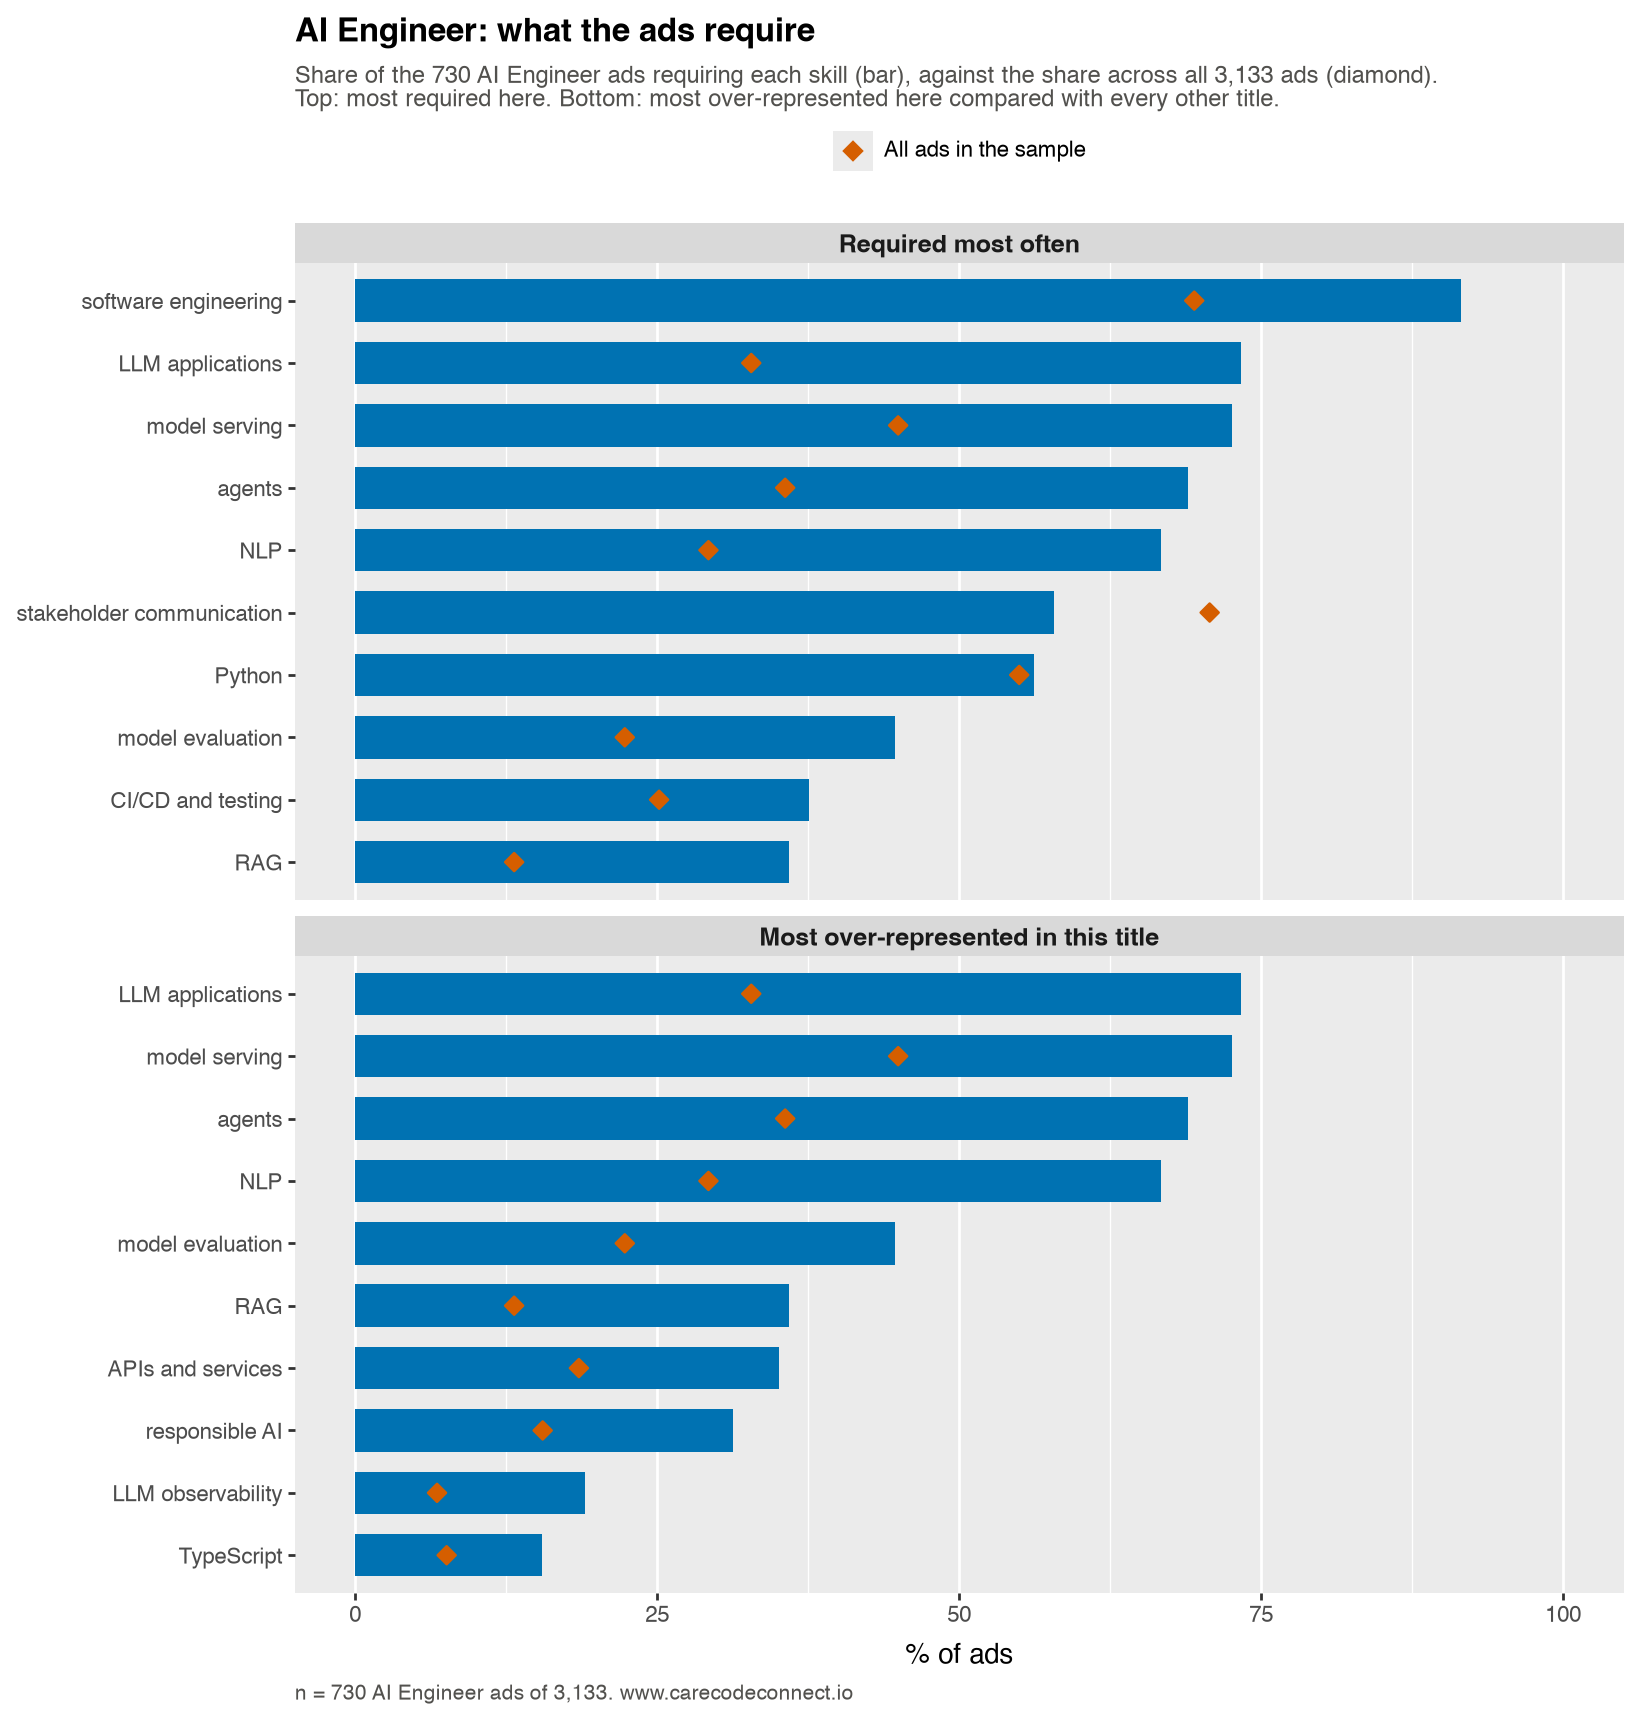
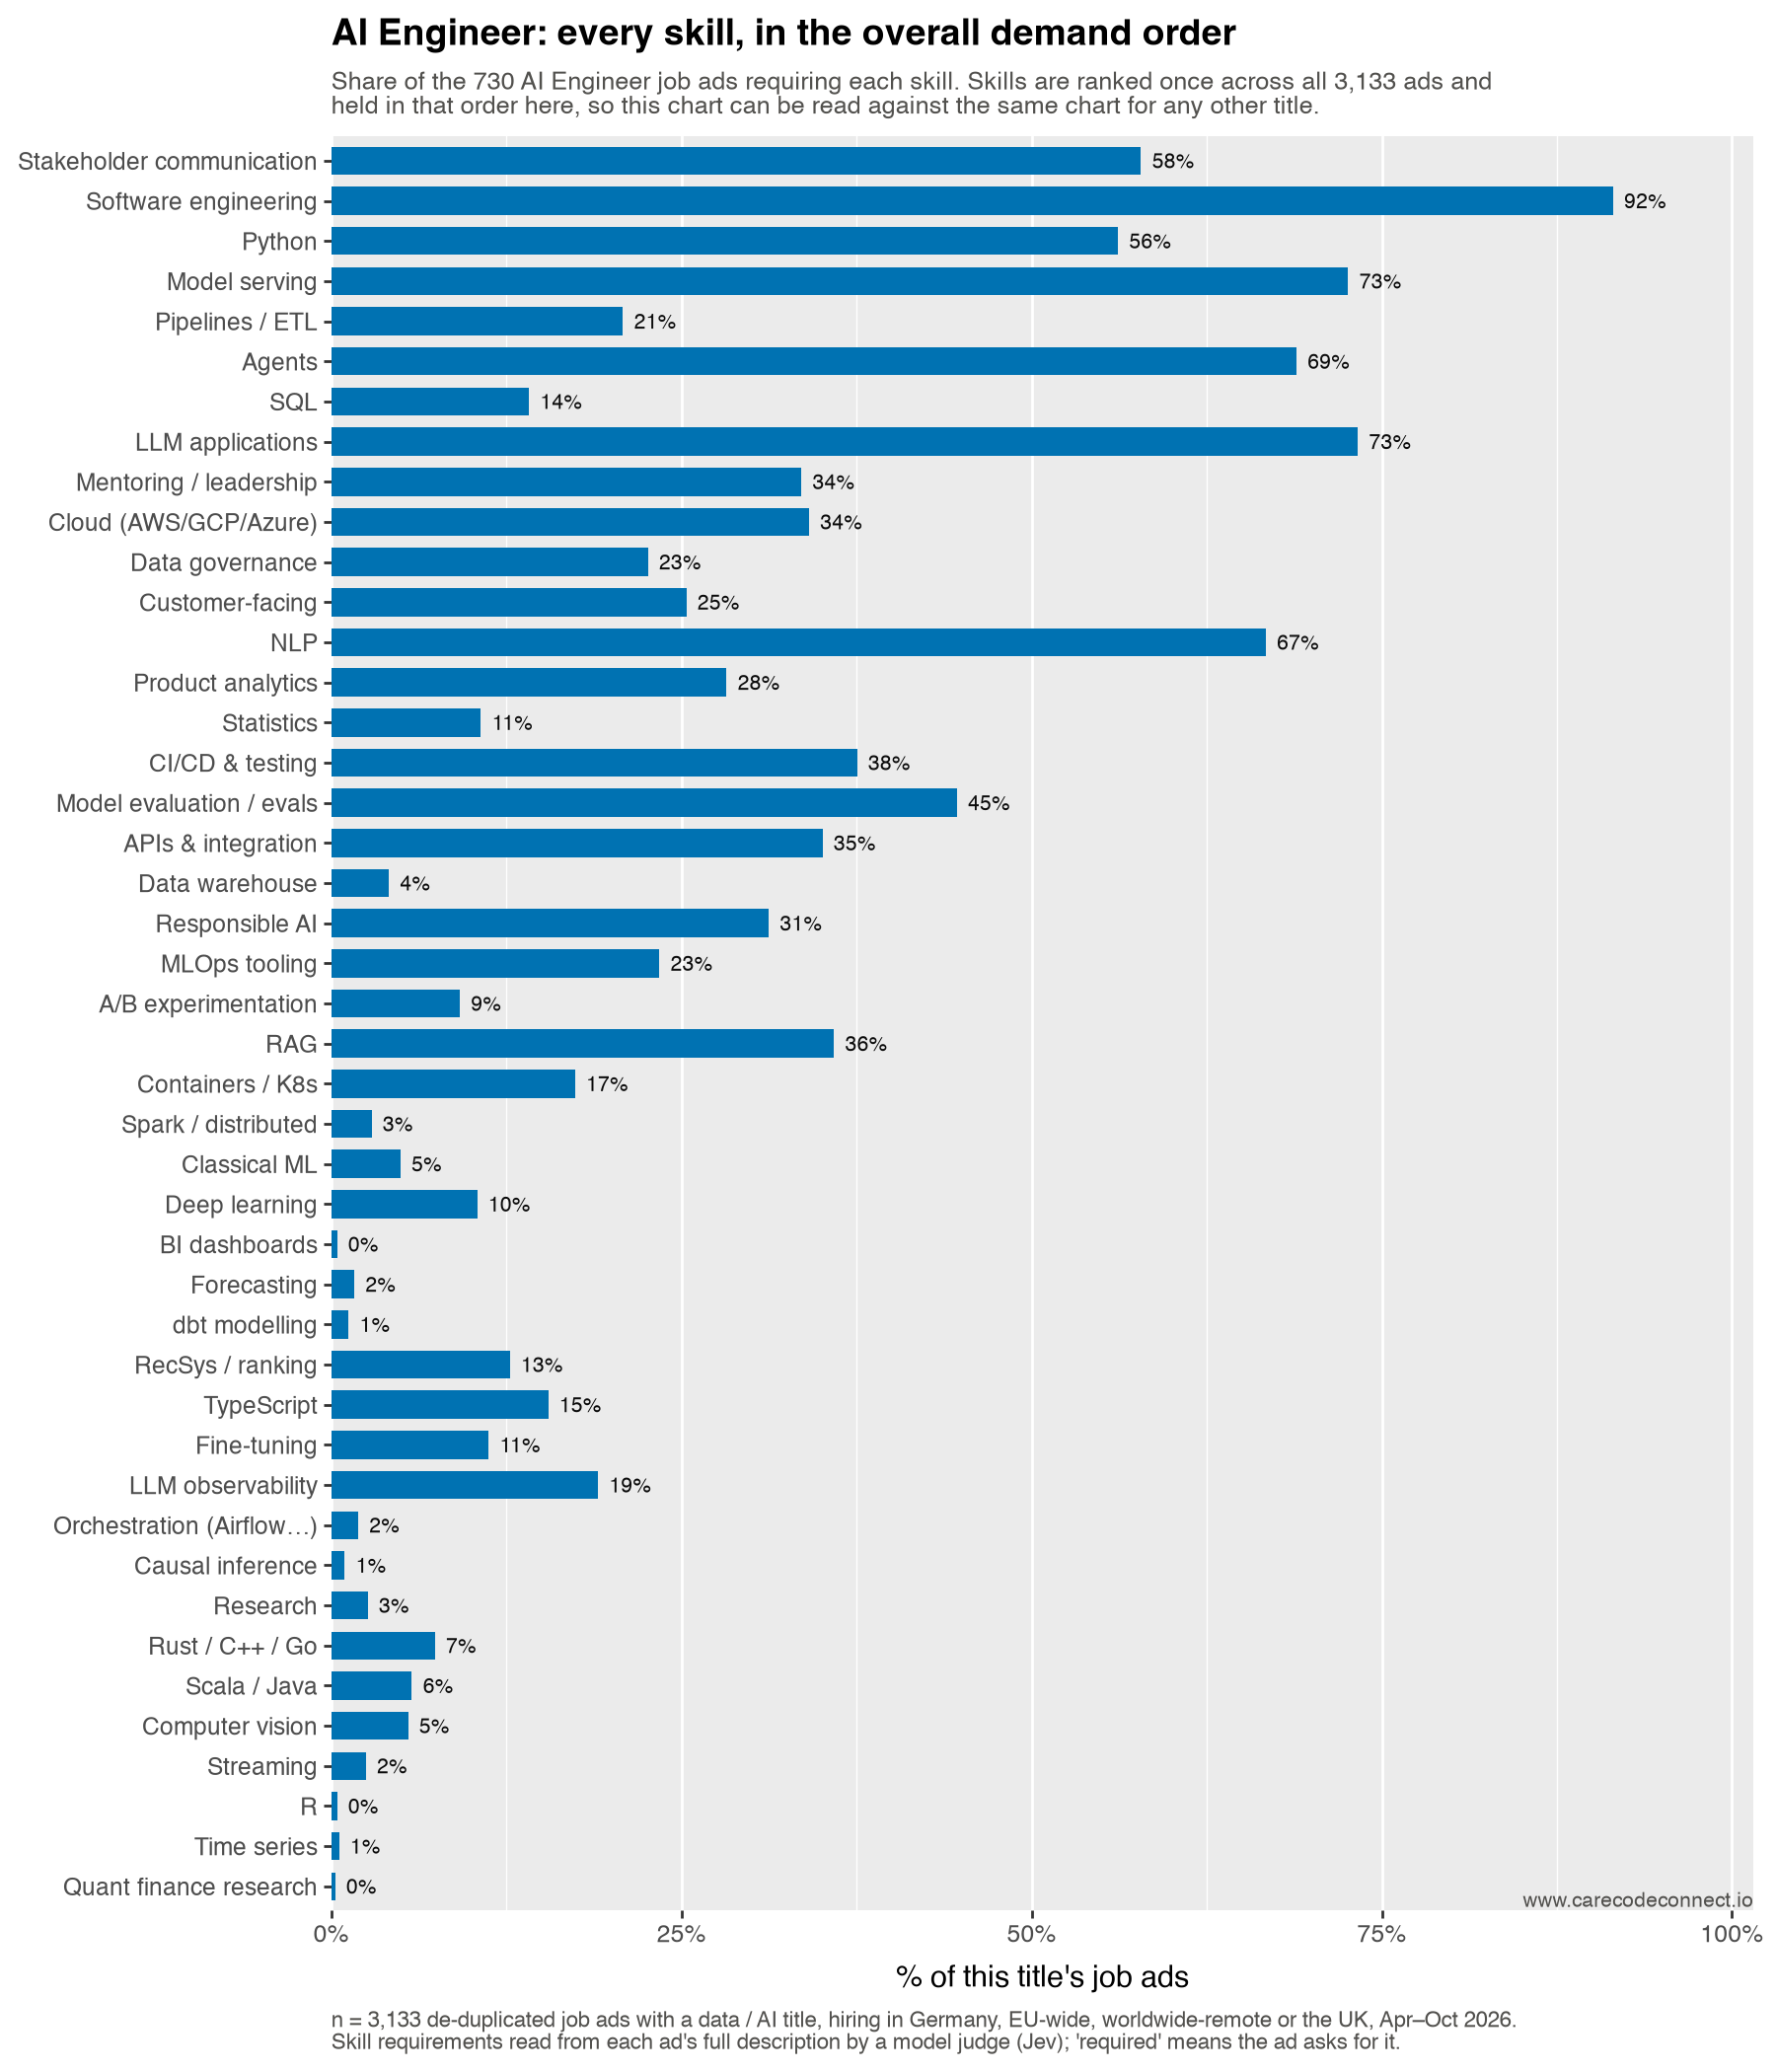
Take-home. 74% of these ads want both a model and its deployment and 12% a model without it; the most distinctive requirement is RAG, and the nearest title is AI Automation.
Nearest neighbour. AI Automation (0.75 apart on the skills map), then ML Engineer (1.06). Furthest: Analytics Engineer (2.15).
Build or call. 31% build or train a model, 80% call one over an API, and 55% want the API work with no model-building at all.
In the ads’ own words. The phrases most over-represented in this title, read out of the ads by a second model that was never shown our skill list, with the share of the title’s ads using each: “langgraph” (14%), “tool use” (7%), “vector search” (5%), “rag” (22%), “prompt engineering” (23%).
using large language models, RAG, vector search
— one of 163 AI Engineer job ads (22% of the title) that ask for “rag”
AI application patterns (RAG, agents, tool use)
— one of 13 AI Engineer job ads (2% of the title) that ask for “agents”
Exposure to fine-tuning or continuous learning techniques
— one of 41 AI Engineer job ads (6% of the title) that ask for “fine-tuning”
Note10. AI Automation
~2024 · 55 ads, 2% of the sample
The newest family here, and the one the crawler began tracking last. The titles are AI, agentic, intelligent or workflow automation — Engineer, Specialist, Lead or Consultant — and they describe wiring an LLM into a business process rather than building a model. The QA, industrial and robotic-process senses of the word are excluded; they are a different job. Read its share as a floor, not a measurement: the crawler only began admitting these titles in the final week of this window, and only began searching sources for them the day after, so earlier months caught them only incidentally, through other search terms.
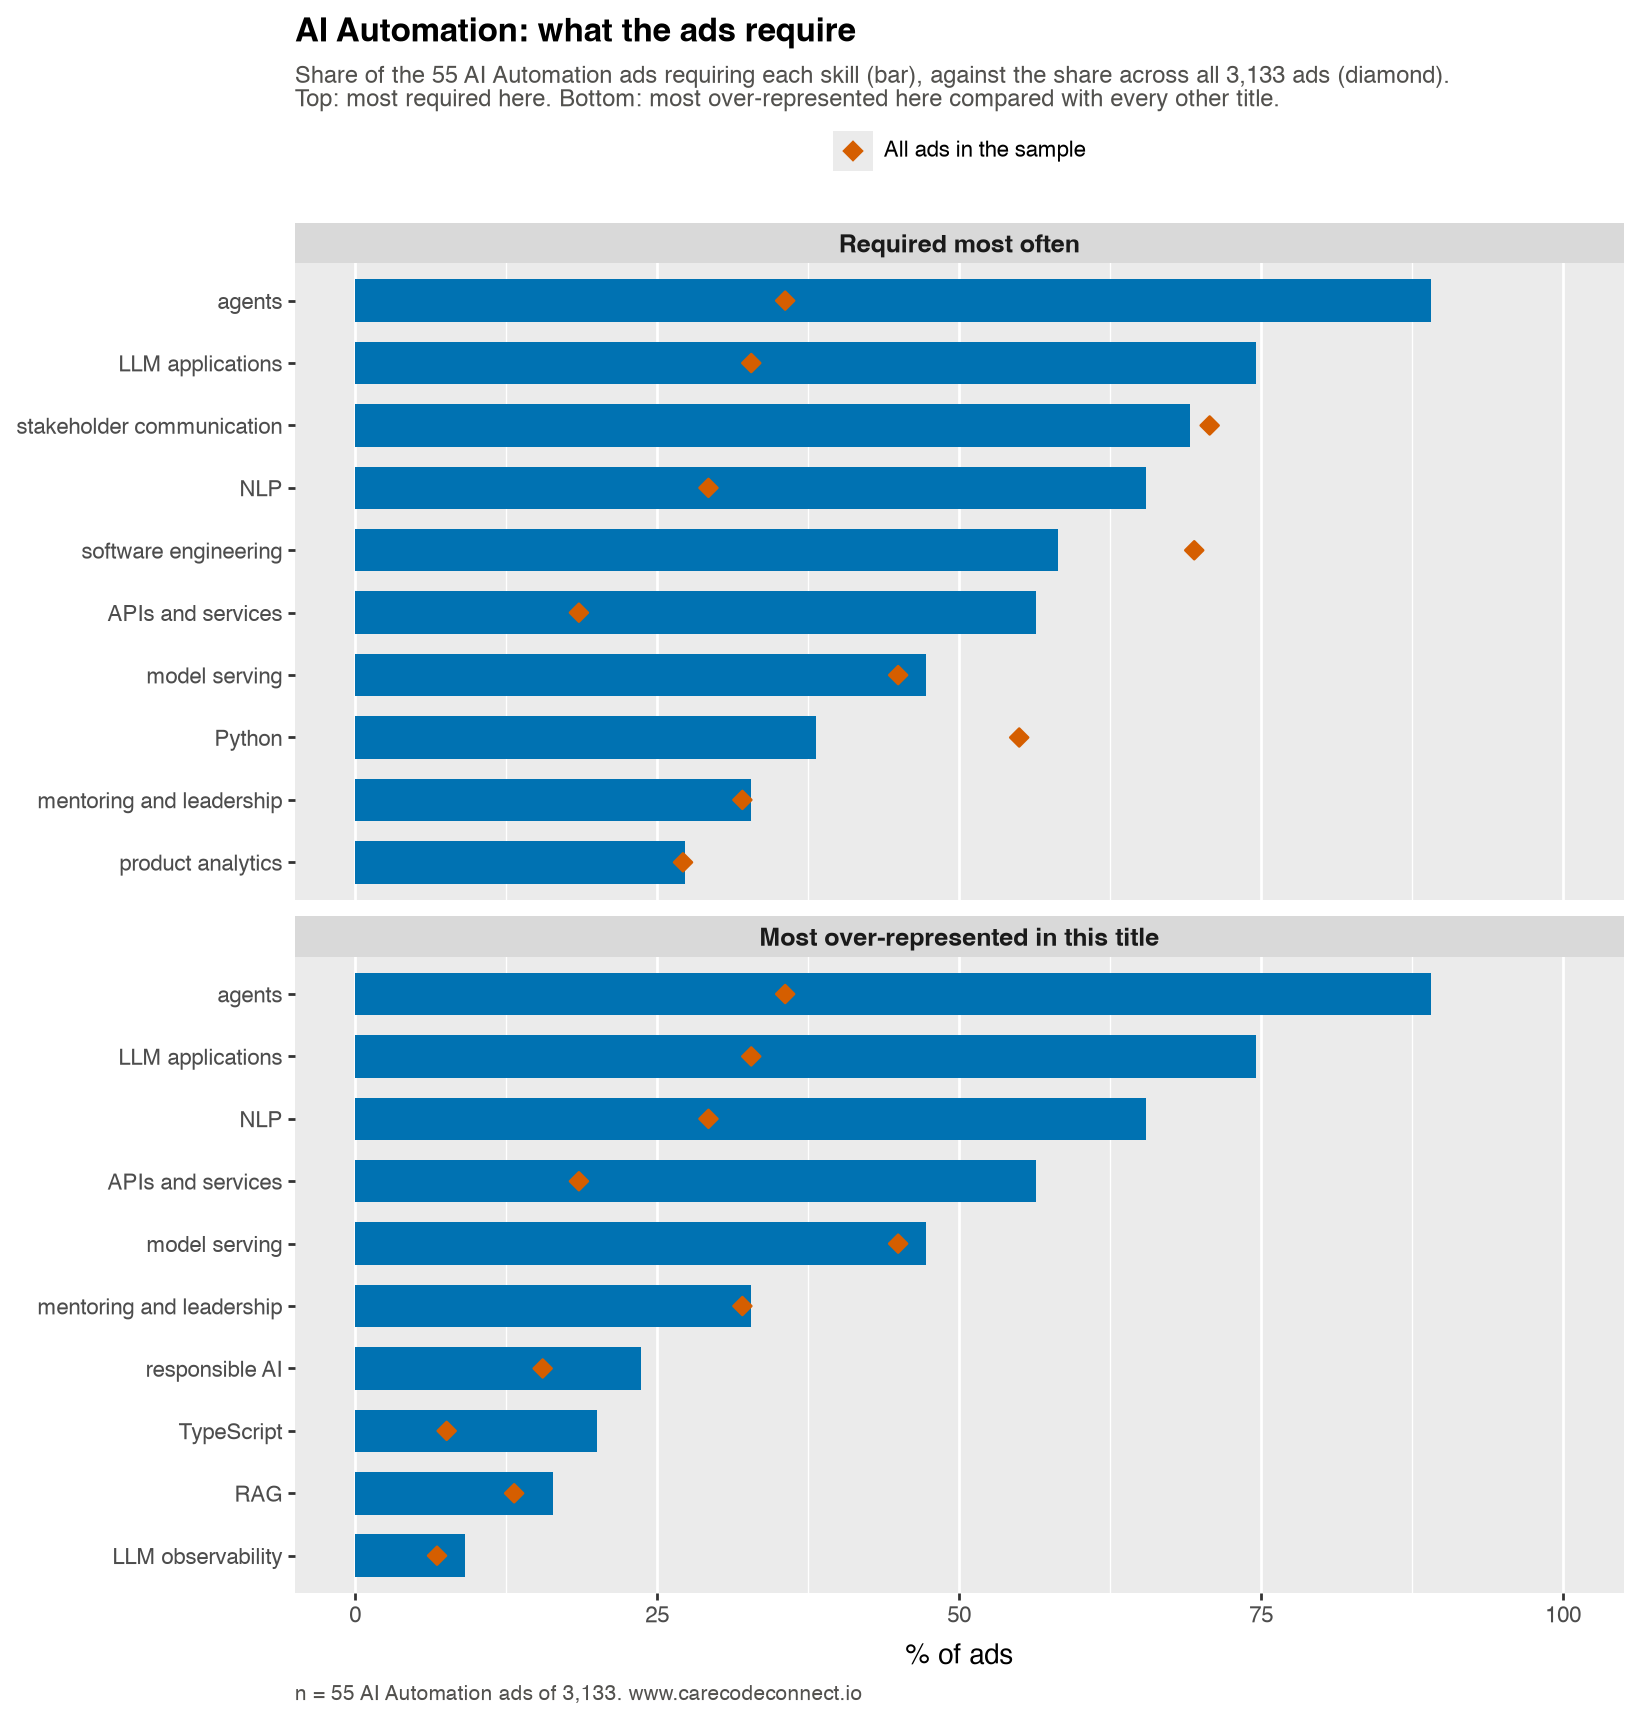
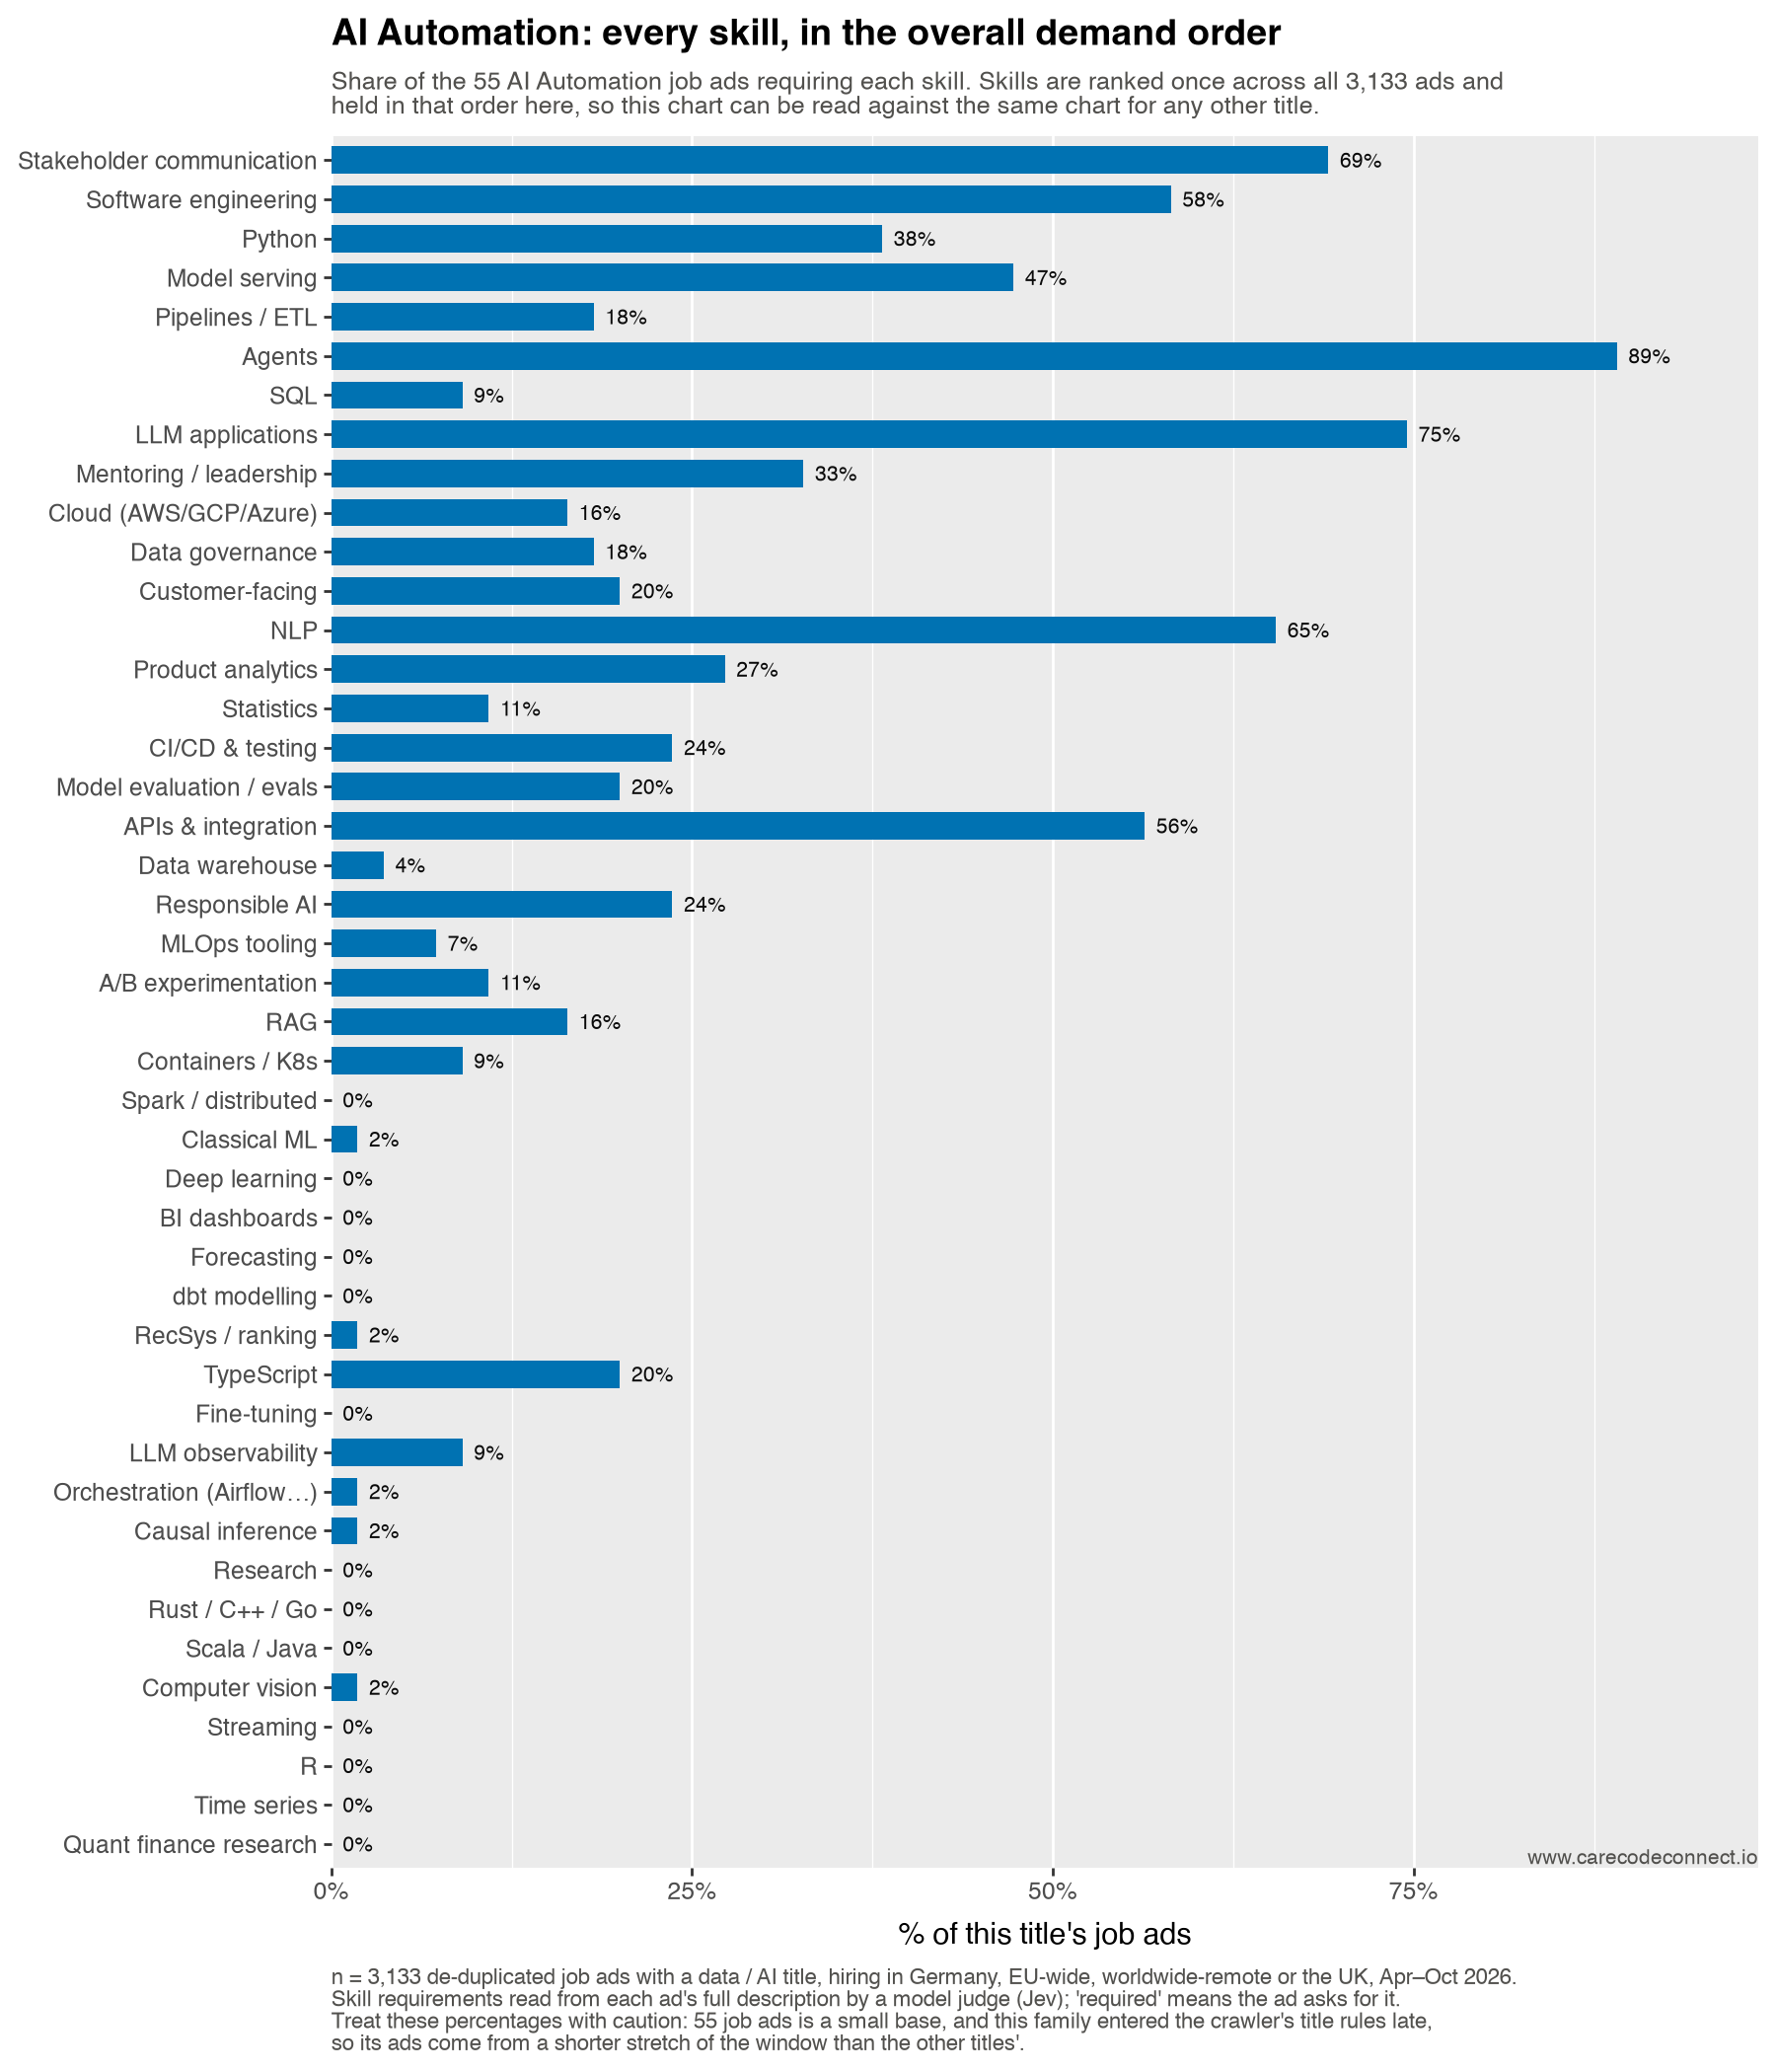
Read these percentages with caution. 55 job ads is a small base: a single ad moves any figure here by about 2 points. On top of that it entered the crawler’s title rules late — 53% of its ads fall in the final month against 35% for the sample — so a difference against another title here may be when the ads were collected rather than what the title asks for.
Take-home. 62% of these ads want both a model and its deployment and 27% a model without it; the most distinctive requirement is APIs and services, and the nearest title is AI Engineer.
Nearest neighbour. AI Engineer (0.75 apart on the skills map), then Forward Deployed (1.22). Furthest: Analytics Engineer (2.13).
Build or call. 5% build or train a model, 89% call one over an API, and 84% want the API work with no model-building at all.
In the ads’ own words. The phrases most over-represented in this title, read out of the ads by a second model that was never shown our skill list, with the share of the title’s ads using each: “microsoft copilot” (9%), “make” (16%), “zendesk” (7%), “zapier” (16%), “power apps” (7%).
Conclusions
AI and data work has stopped being one job.
Which skills employers ask for together: three bundles, and one asked for everywhere. Building and running software including LLM work (82% of job ads), the data platform underneath it (83%), and statistics and inference (52%). Communication is not a fourth bundle but the ground all three stand on, required in 79% of job ads. Stakeholder communication alone is the single most-required skill in the sample, at 71%, ahead of Python at 55%.
Whether the classic definition still fits: no, and what it misses is deployment. What has changed since 2010 is not the modelling. It is that the ad now expects the model to run in production: 49% of Data Scientist job ads ask for both, and among those asking for a model at all, 75% also ask for its deployment. Conway’s three circles are kinds of knowledge — code, maths, domain — and none of them is shipping and running the result. Nor is “AI Engineer” simply the new name for “Data Scientist”: the two are 1.43 apart on what they require, further than Data Scientist is from Data Analyst, and what separates them is statistics — 73% of Data Scientist job ads against 11% of AI Engineer ones.
How the titles divide that work: one title per region. Each combination of the three bundles is advertised under a different title. The combination needing all three is 35% of the market, and 72% of it is advertised as something other than Data Scientist.
What this can and cannot show.
- Ads, not jobs. They record what employers advertised for, not what the job turned out to be.
- A snapshot, not a trend. The window is 2026-04 to 2026-10 — enough to show how the work is divided today, but nothing here tracks when it divided.
- Read by a model, not a person. A second model, asked the same question independently, agrees moderately (Cohen’s κ ≈ 0.36).
- Not a random sample, and the sampling frame moved. These are the ads one crawler targets, so they describe what these titles ask for, not how many of each exist. The crawler is an ingestion pipeline under active development: title rules, regions and sources were all widened during the window, so a title’s share reflects when the crawler started looking for it as much as how often employers post it. Shares are the least trustworthy numbers on this page; what each title asks for, measured within that title, is the most.
- Not every title was collected for the whole window. AI Automation entered the crawler’s title rules after collection had begun: 53% of its job ads fall in the final month, against 35% for the sample. Its skill profile stands; its count is a floor.
- So: read every percentage as approximate. A gap as wide as statistics — 73% of Data Scientist ads against 11% of AI Engineer ads — is unlikely to be an artefact of a few points of noise; a gap of a few points may well be.
References
Anthropic. 2026. “Claude Haiku.” https://www.anthropic.com/claude/haiku.
Conway, Drew. 2010. “The Data Science Venn Diagram.” http://drewconway.com/zia/2013/3/26/the-data-science-venn-diagram.
Davenport, Thomas H., and D. J. Patil. 2012. “Data Scientist: The Sexiest Job of the 21st Century.” Harvard Business Review, October. https://hbr.org/2012/10/data-scientist-the-sexiest-job-of-the-21st-century.
Janssens, Jeroen. 2021. Data Science at the Command Line. 2nd ed. O’Reilly Media. https://datascienceatthecommandline.com/2e/chapter-1-introduction.
Maaten, Laurens van der, and Geoffrey Hinton. 2008. “Visualizing Data Using t-SNE.” Journal of Machine Learning Research 9: 2579–2605. https://www.jmlr.org/papers/v9/vandermaaten08a.html.
Mason, Hilary, and Chris Wiggins. 2010. “A Taxonomy of Data Science.” dataists. https://web.archive.org/web/20160220042455/dataists.com/2010/09/a-taxonomy-of-data-science/.
Okabe, Masataka, and Kei Ito. 2008. “Color Universal Design: How to Make Figures and Presentations That Are Friendly to Colorblind People.” https://jfly.uni-koeln.de/color/.
Plotly. n.d. “Plotly Open Source Graphing Library for Python.” Accessed October 14, 2026. https://plotly.com/python/.
plotnine contributors. n.d. “Plotnine: A Grammar of Graphics for Python.” Accessed October 14, 2026. https://plotnine.org.
The Matplotlib Development Team. n.d. “Matplotlib: Visualization with Python.” Accessed October 14, 2026. https://matplotlib.org.
TypeSafe. 2026. “Introducing System One Models and Jev.” https://typesafe.ai/blog/introducing-system-one-models-and-jev.
Wickham, Hadley, Mine Çetinkaya-Rundel, and Garrett Grolemund. 2023. R for Data Science. 2nd ed. O’Reilly Media. https://r4ds.hadley.nz/intro.